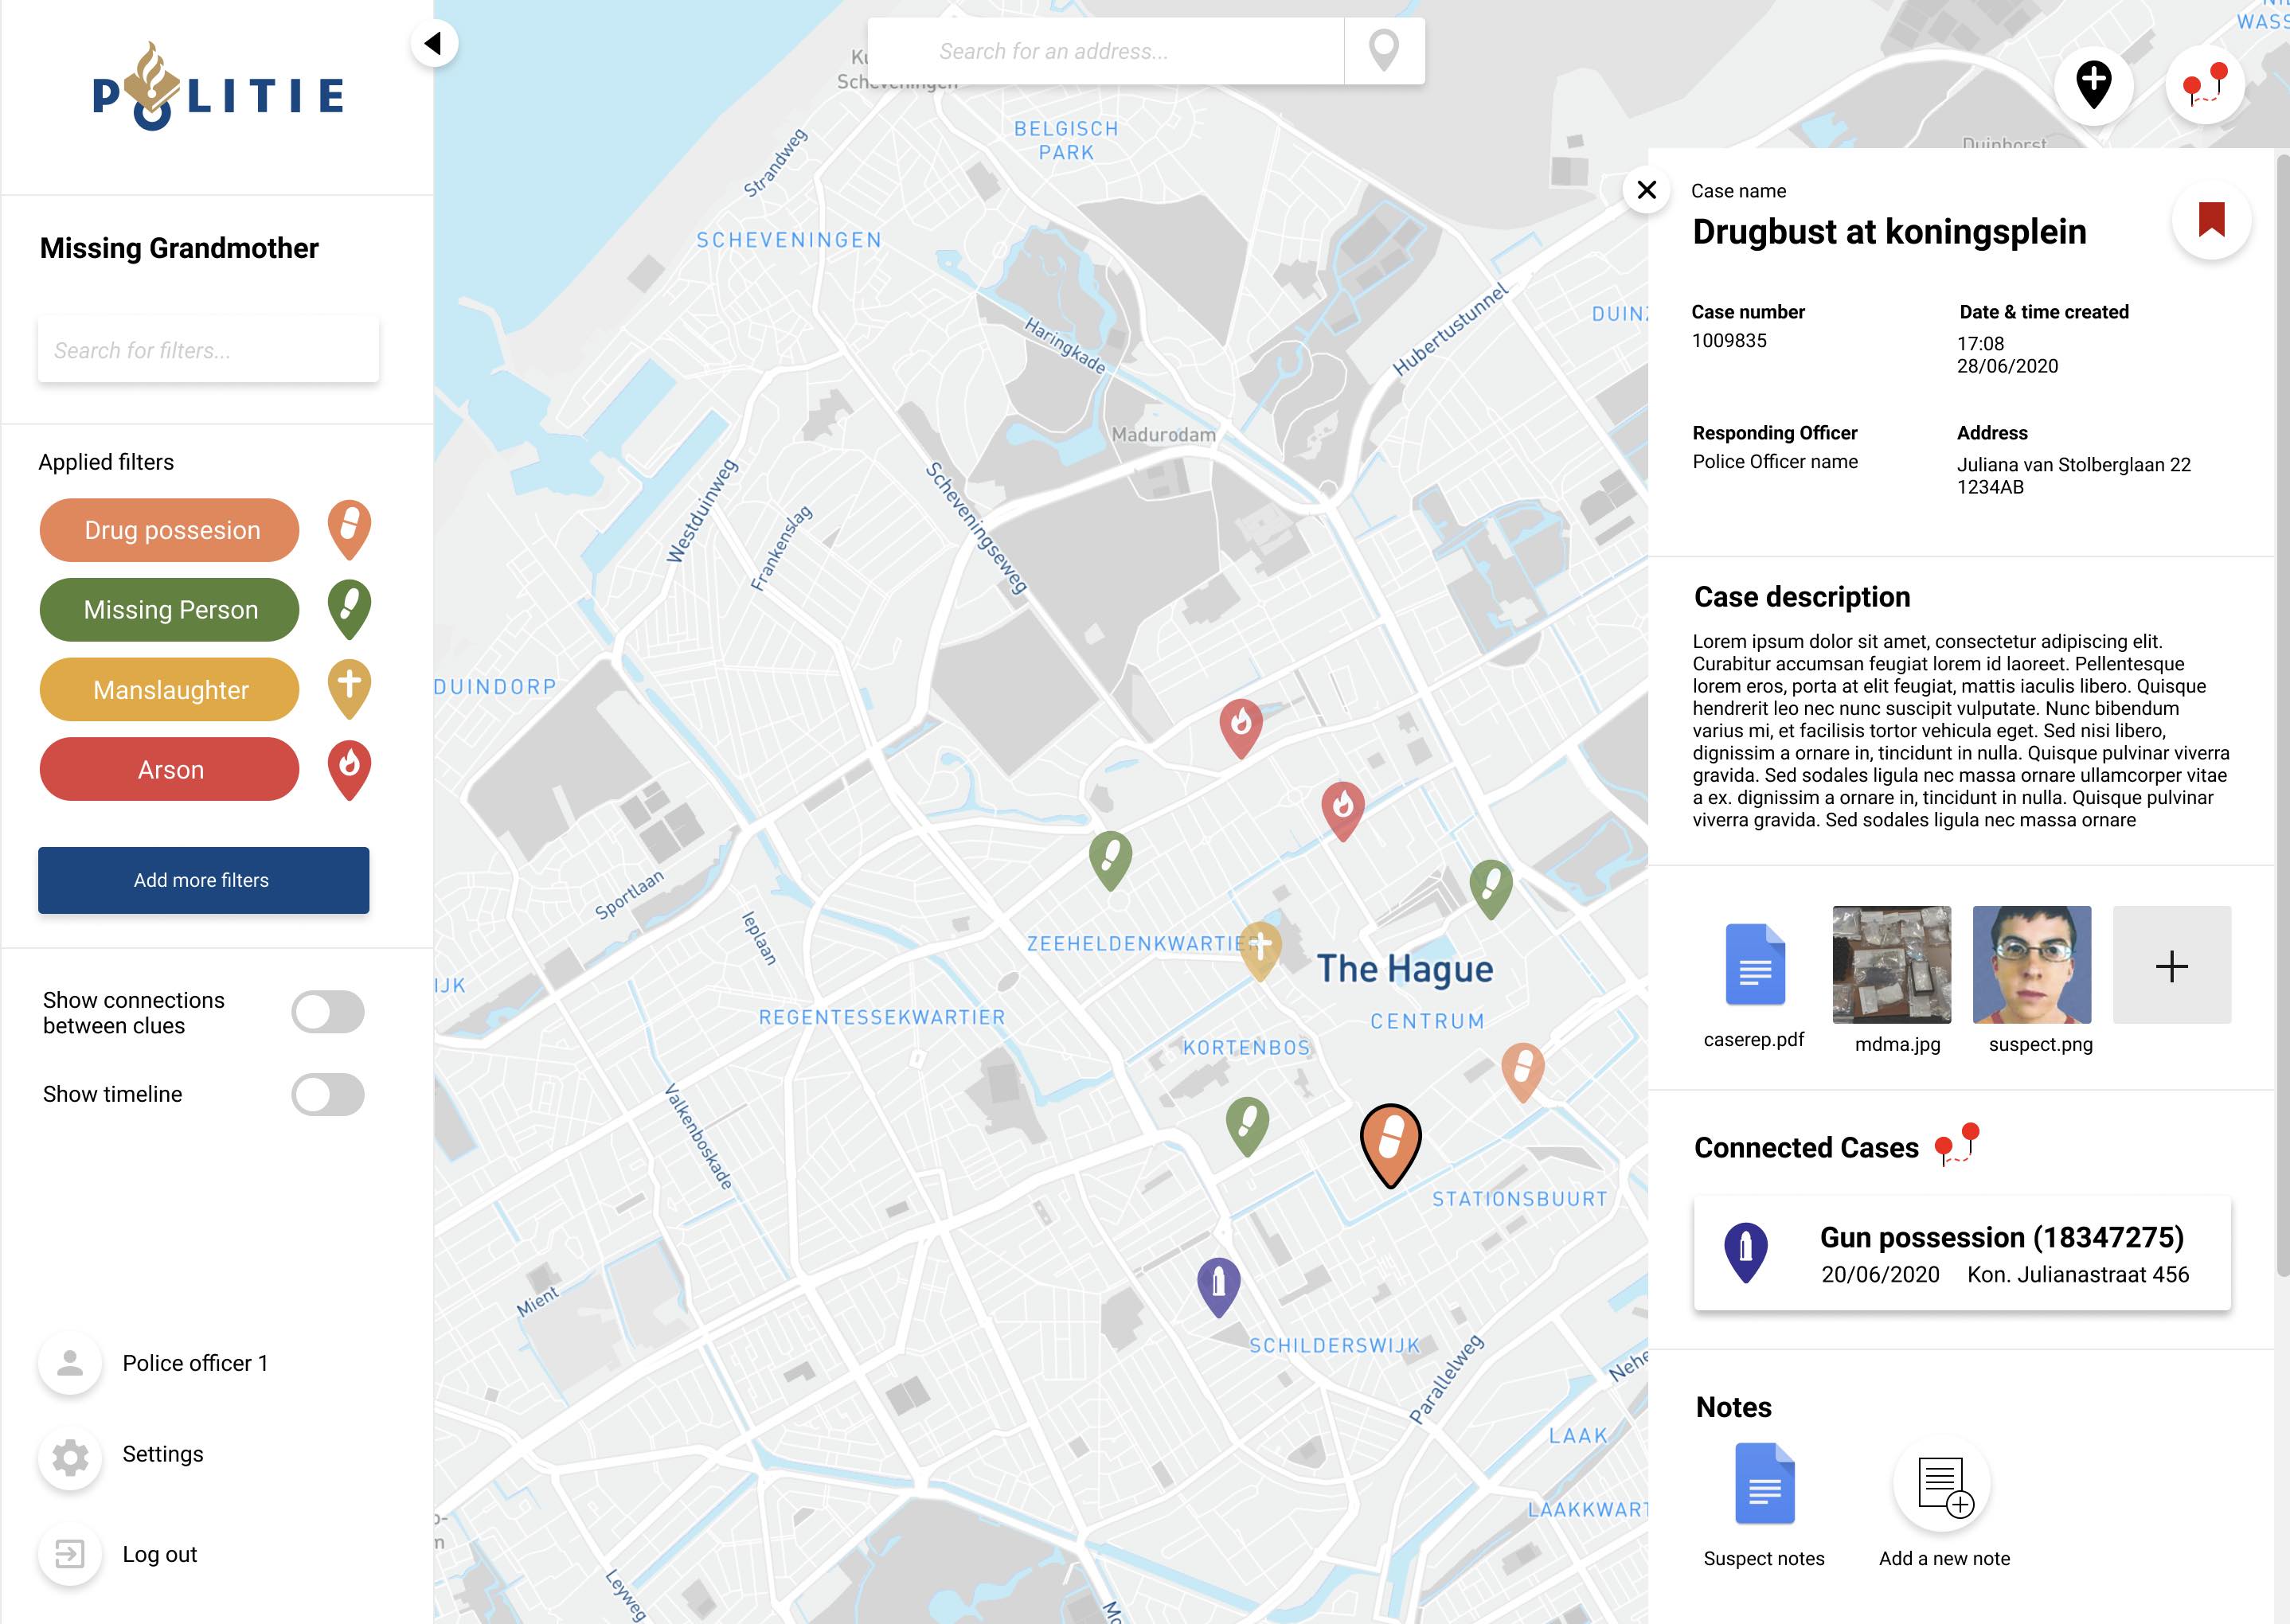
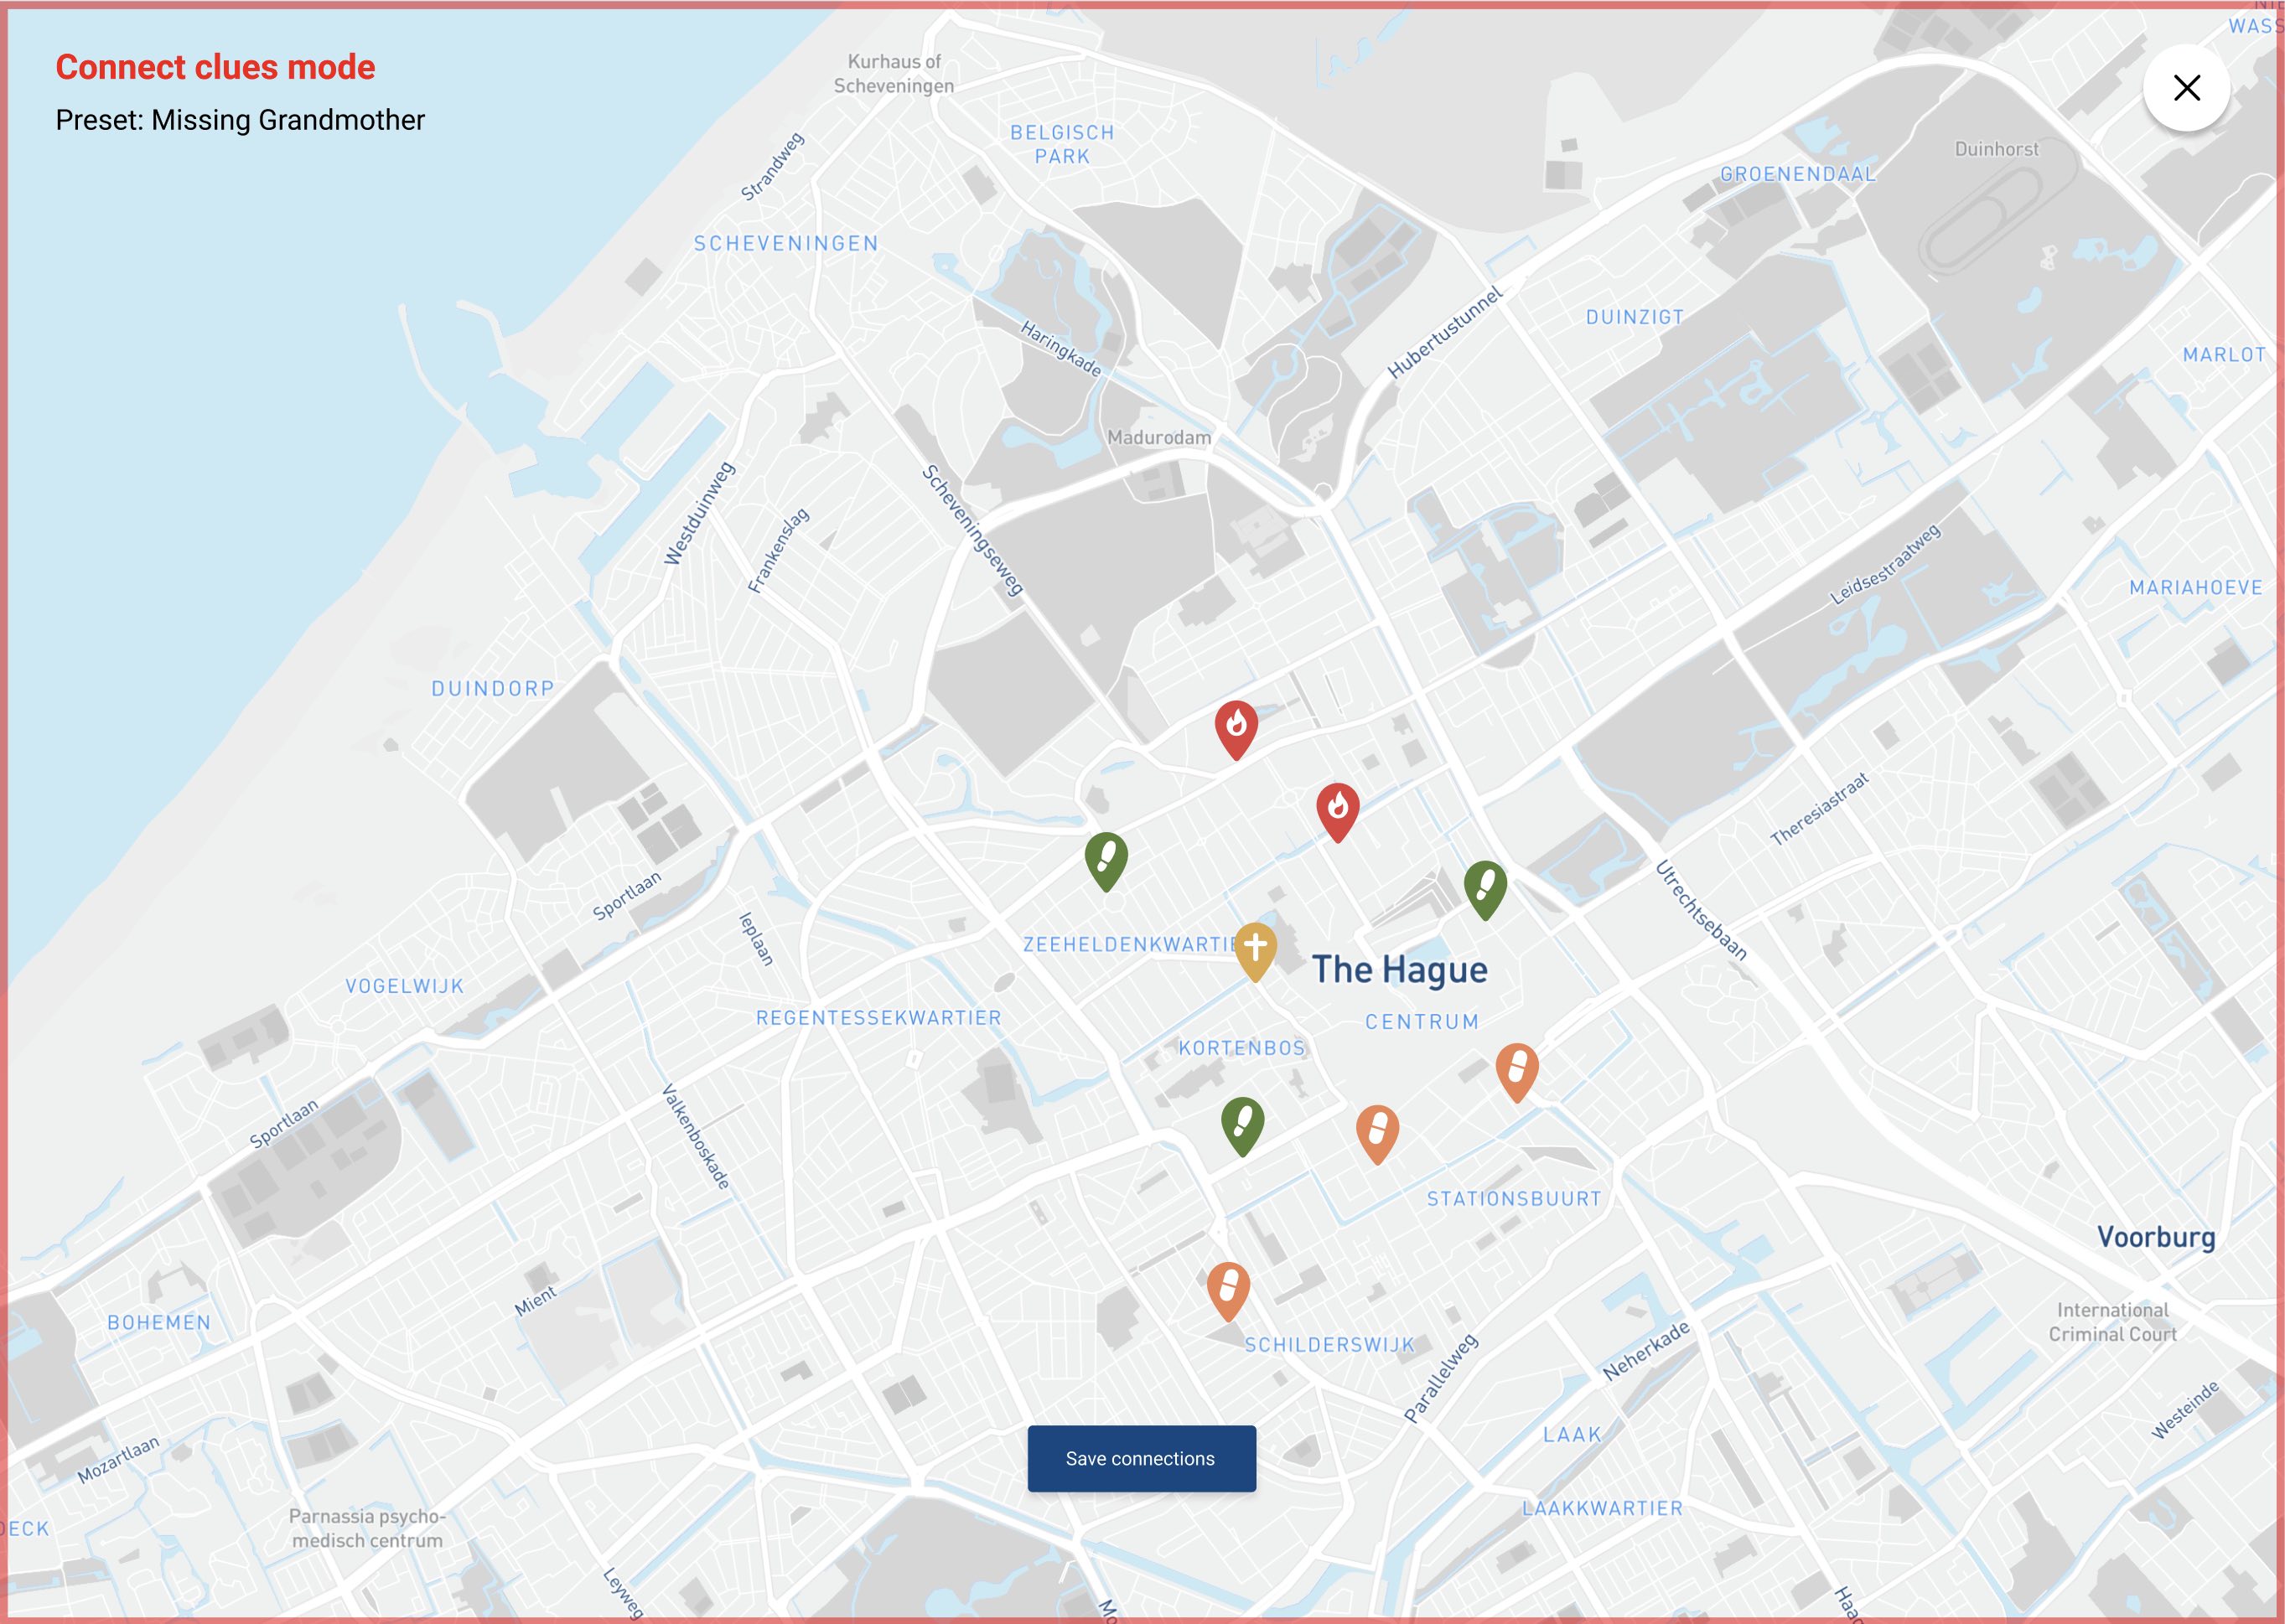
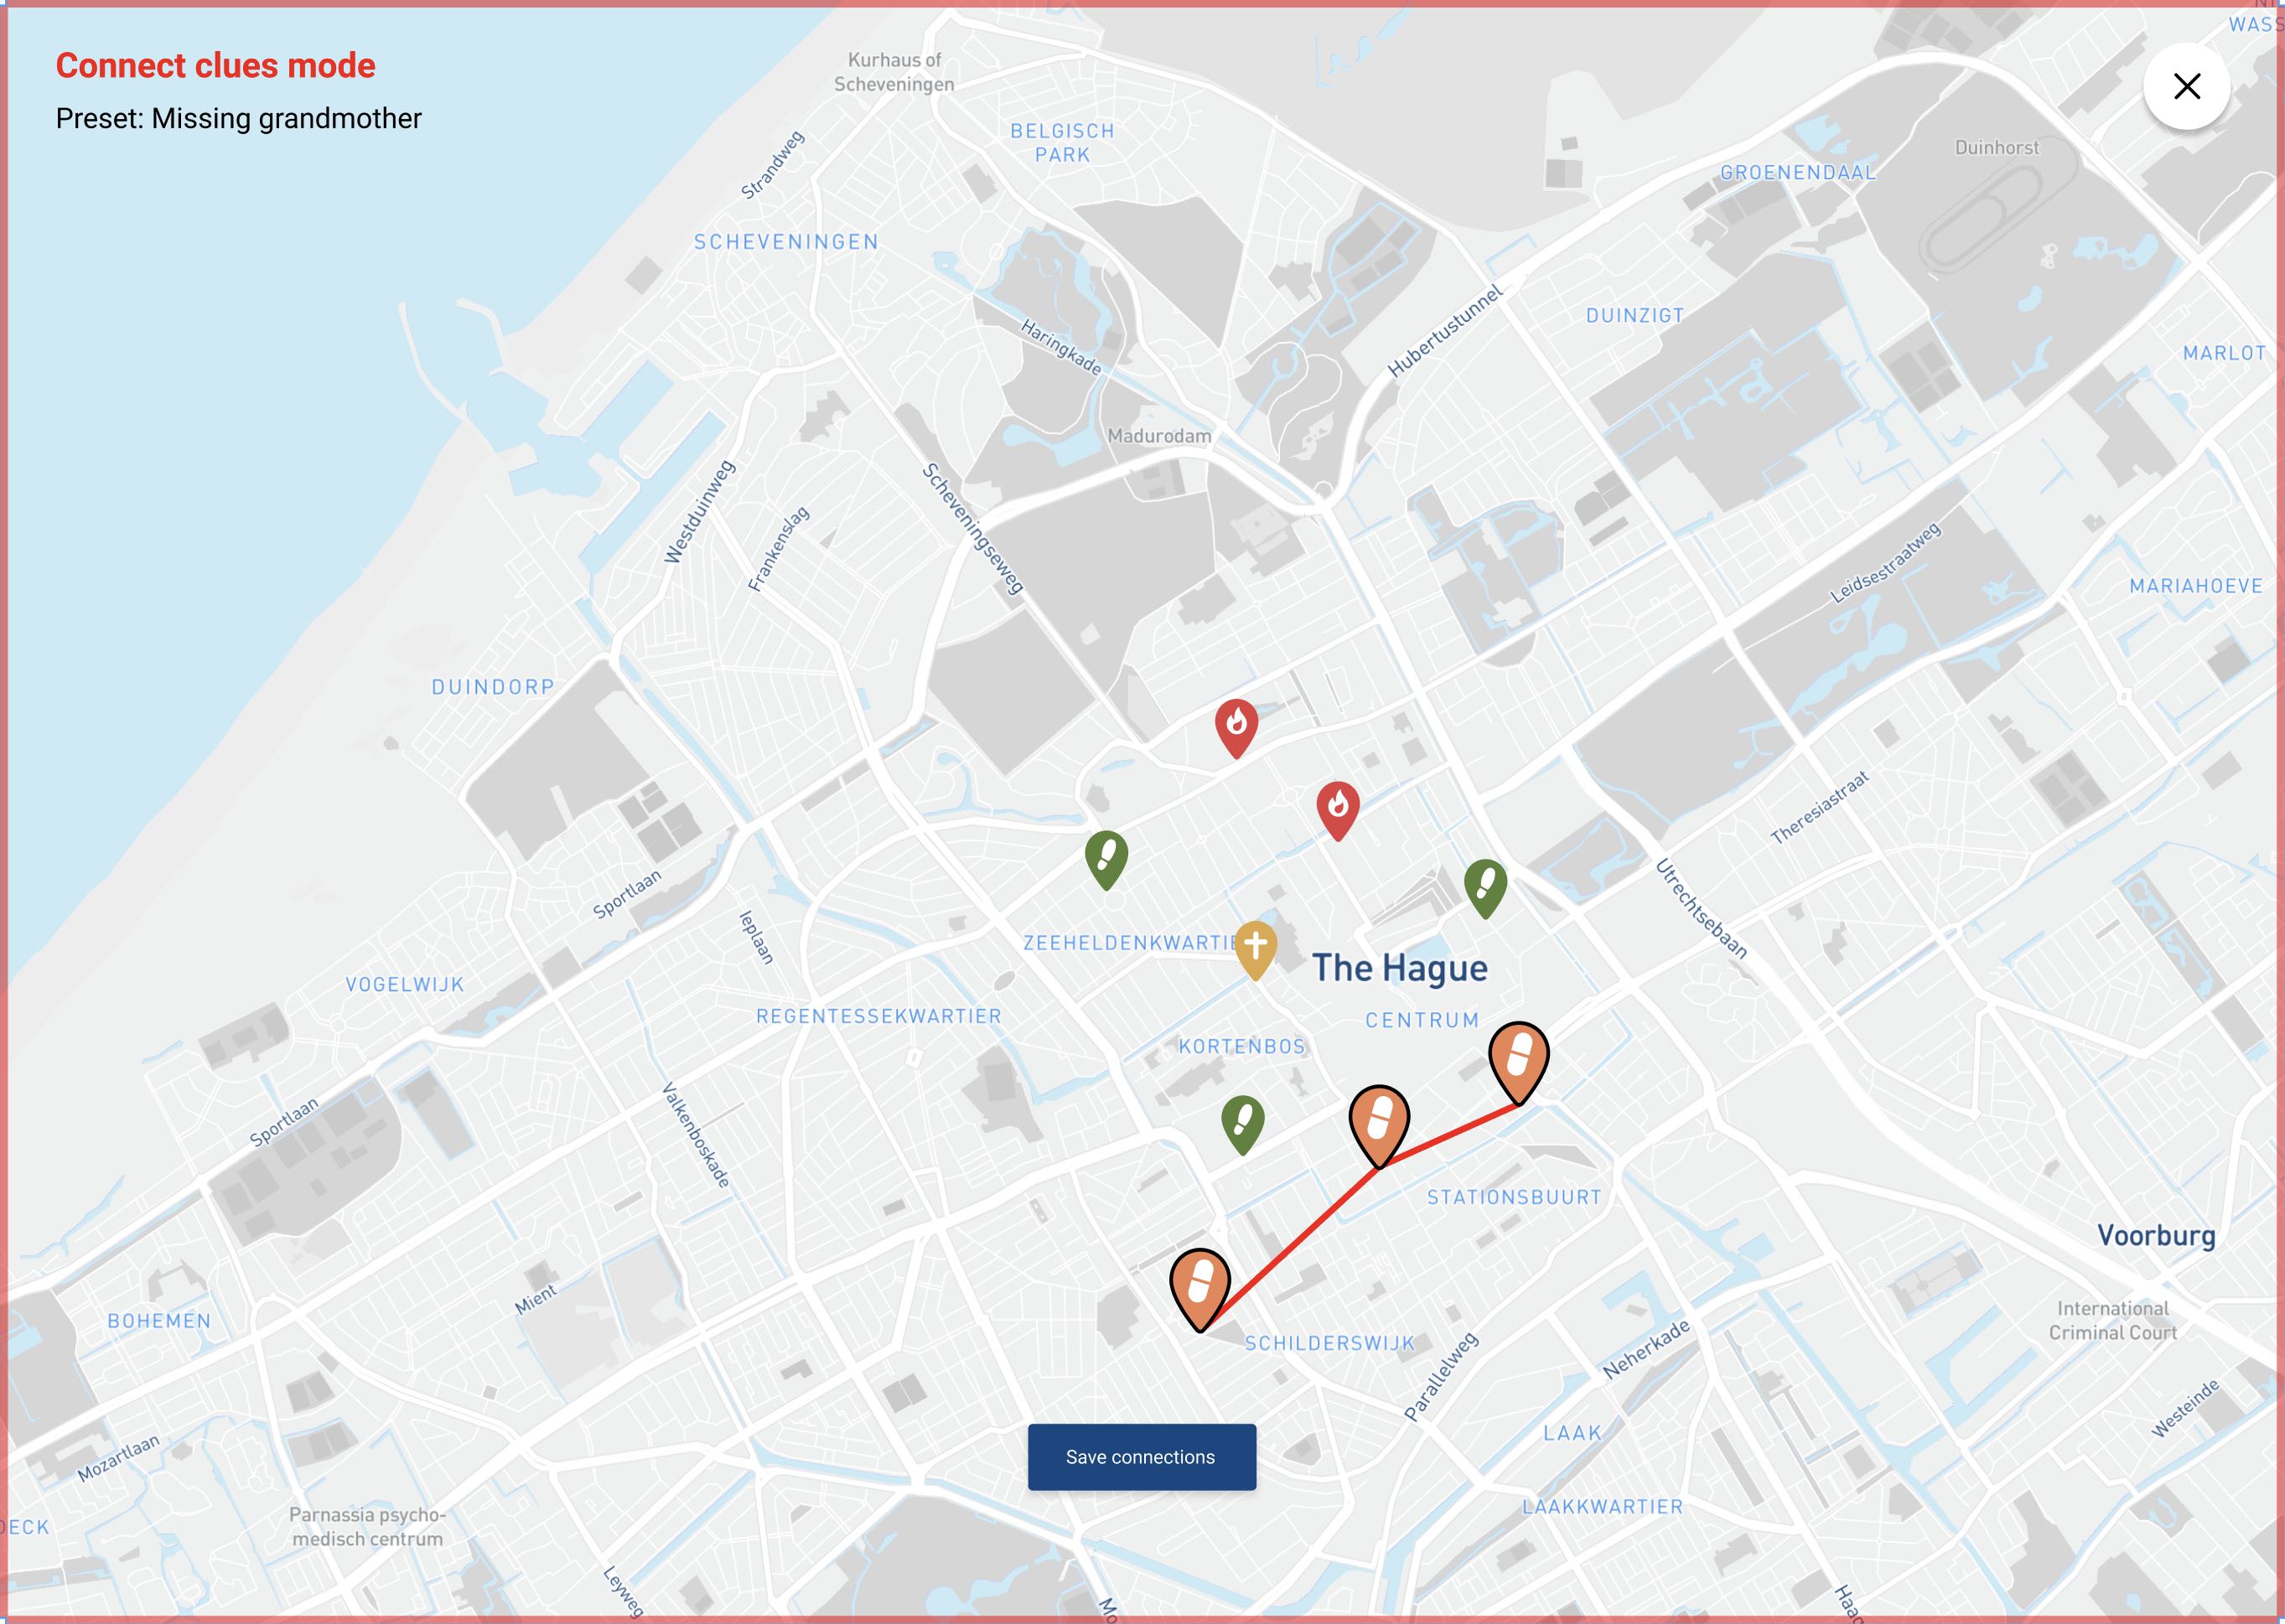
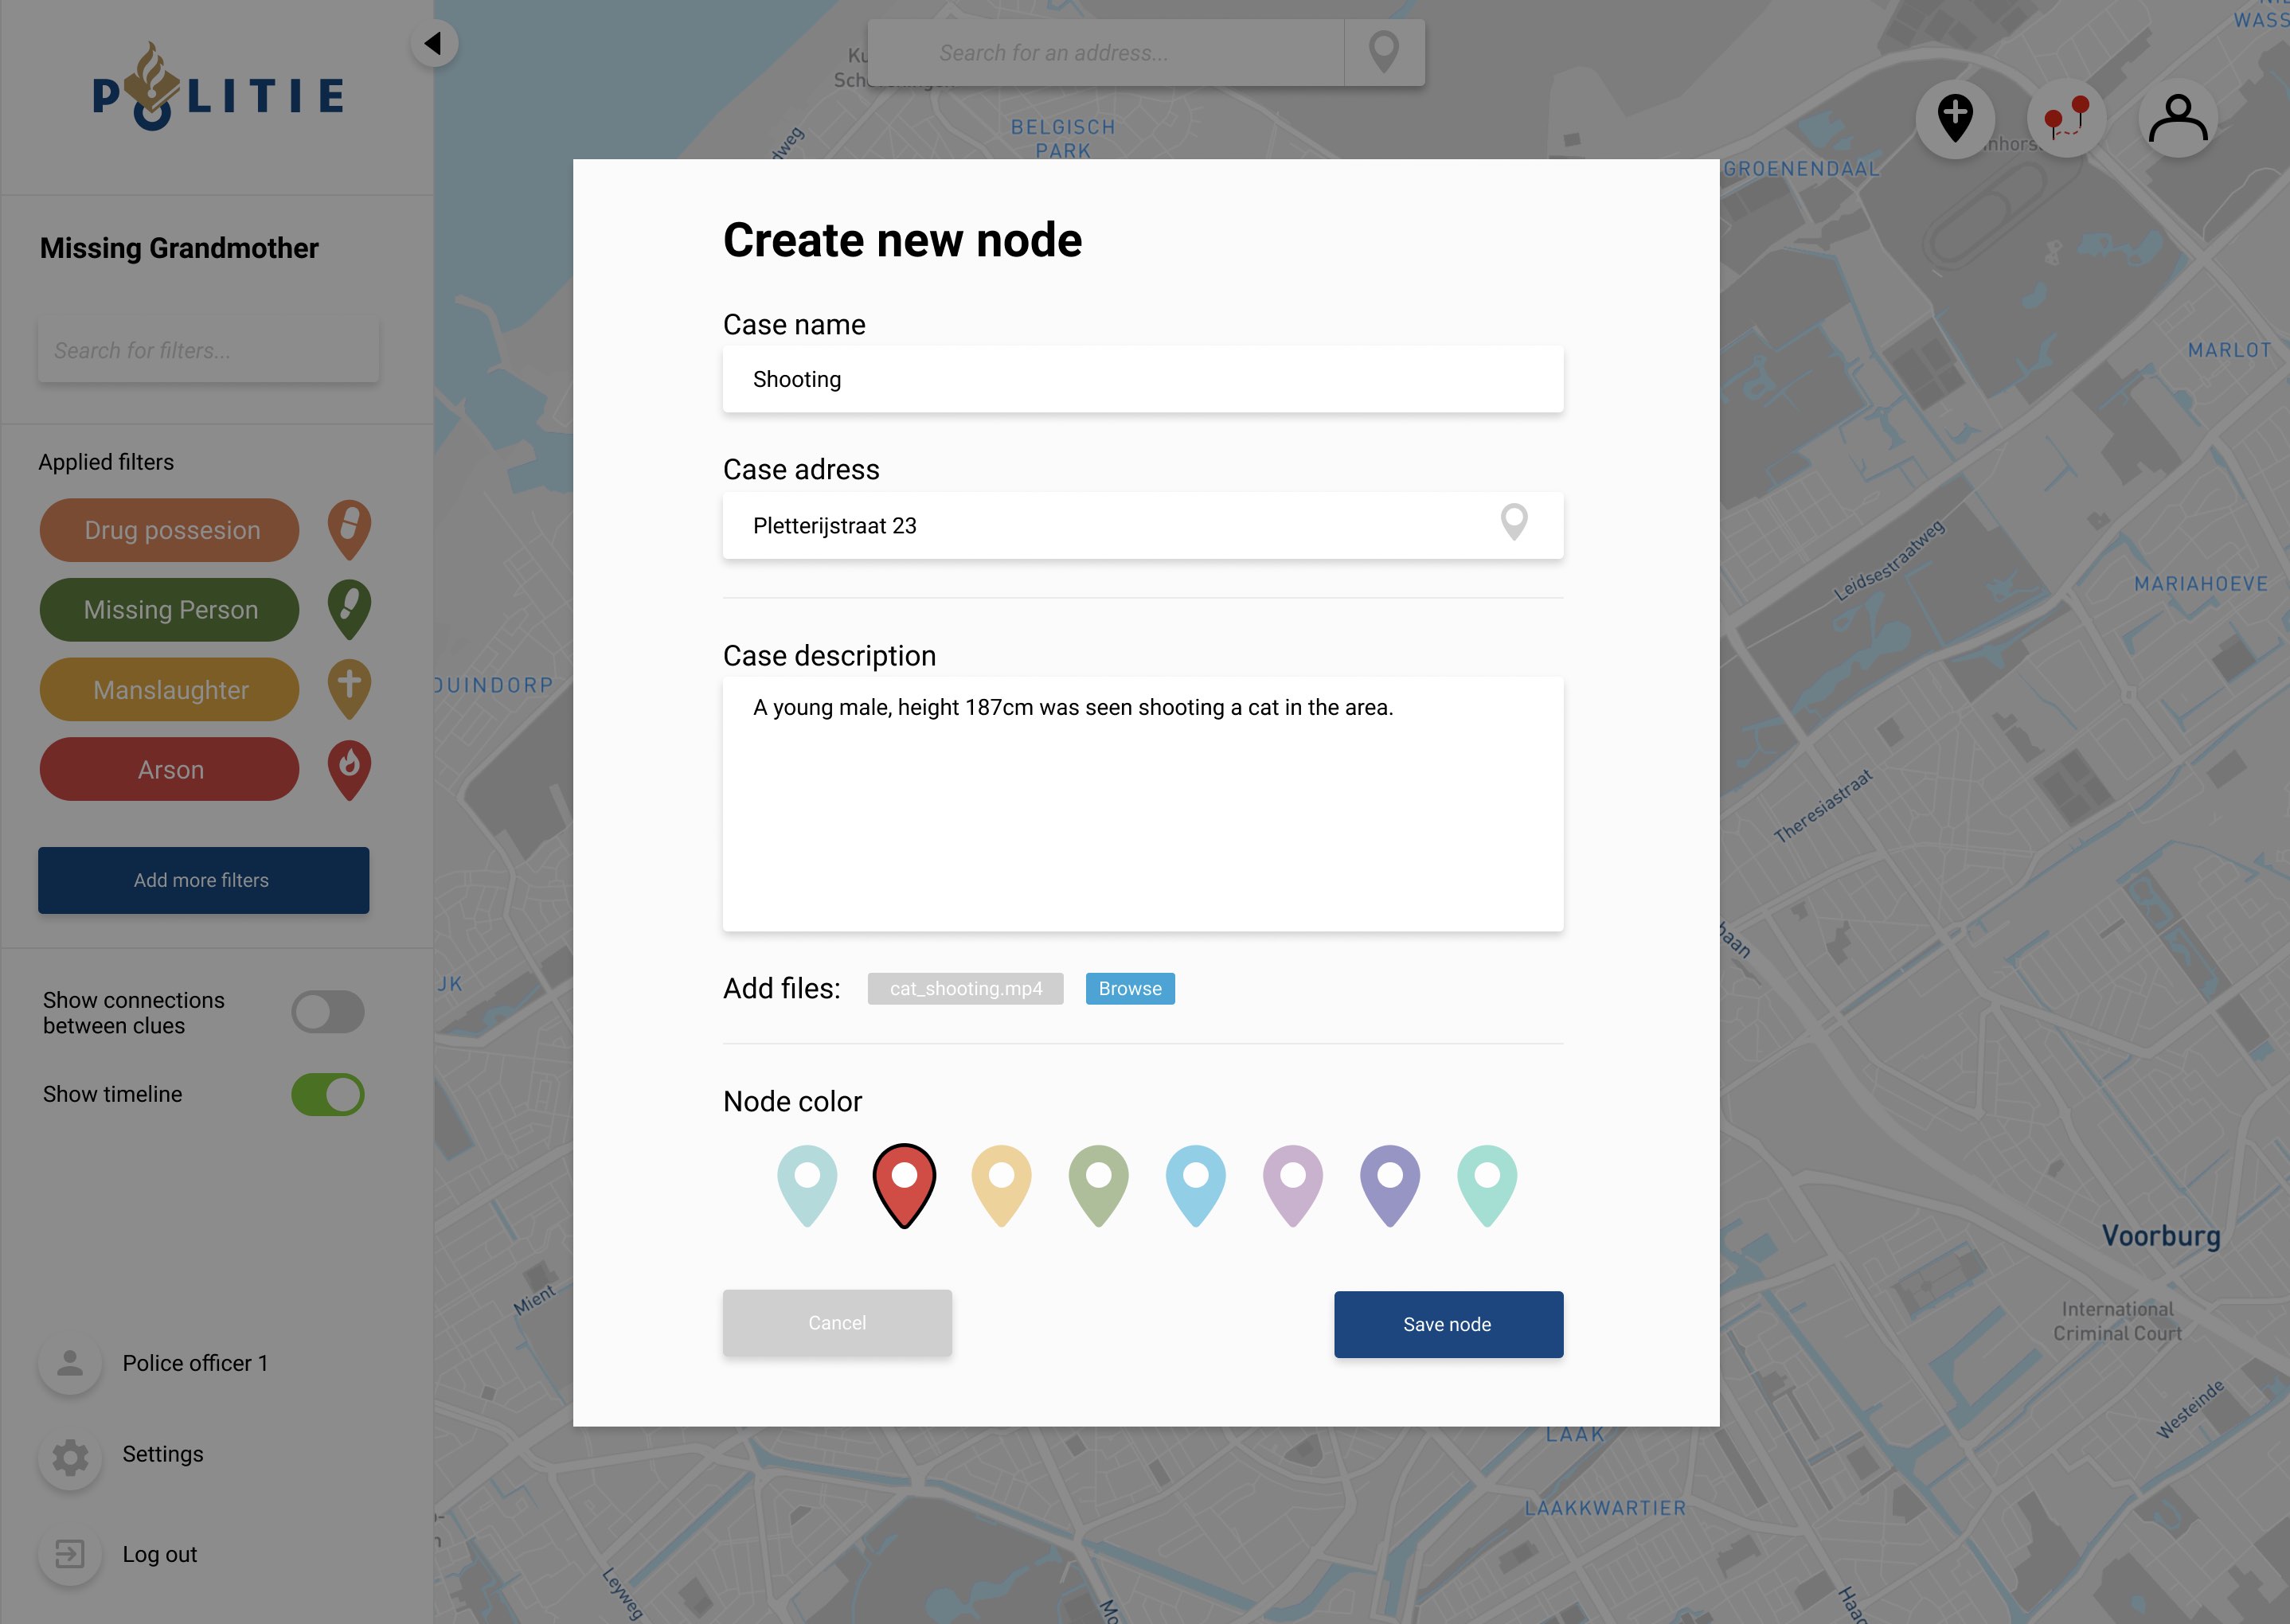
A Map for
Interpreting Data
as an Intelligence Officer

Client
The Hague Police Intelligence Department
Challenge
Creating a map interface that presents crime statistics clearly to police officers drawing their own conclusion from the information.
My Role
UX, UI & Research
Deliverable
A mockup/prototype of the map application

Briefing

The Intelligence Department of the Hague has started a new project in which it will try to visualise data from multiple sources into a clear map. In practice, this means that users of the end product (intelligence officers) will be shown a map in which they can find information about crimes. Several layers of crimes can be put “on top” of each other, to find out where more crimes of particular types can be found. The map will not have analytic tools itself, the user will have to draw his/her conclusion from the information. In other words, the information needs to be presented clearly!

The Final Prototype

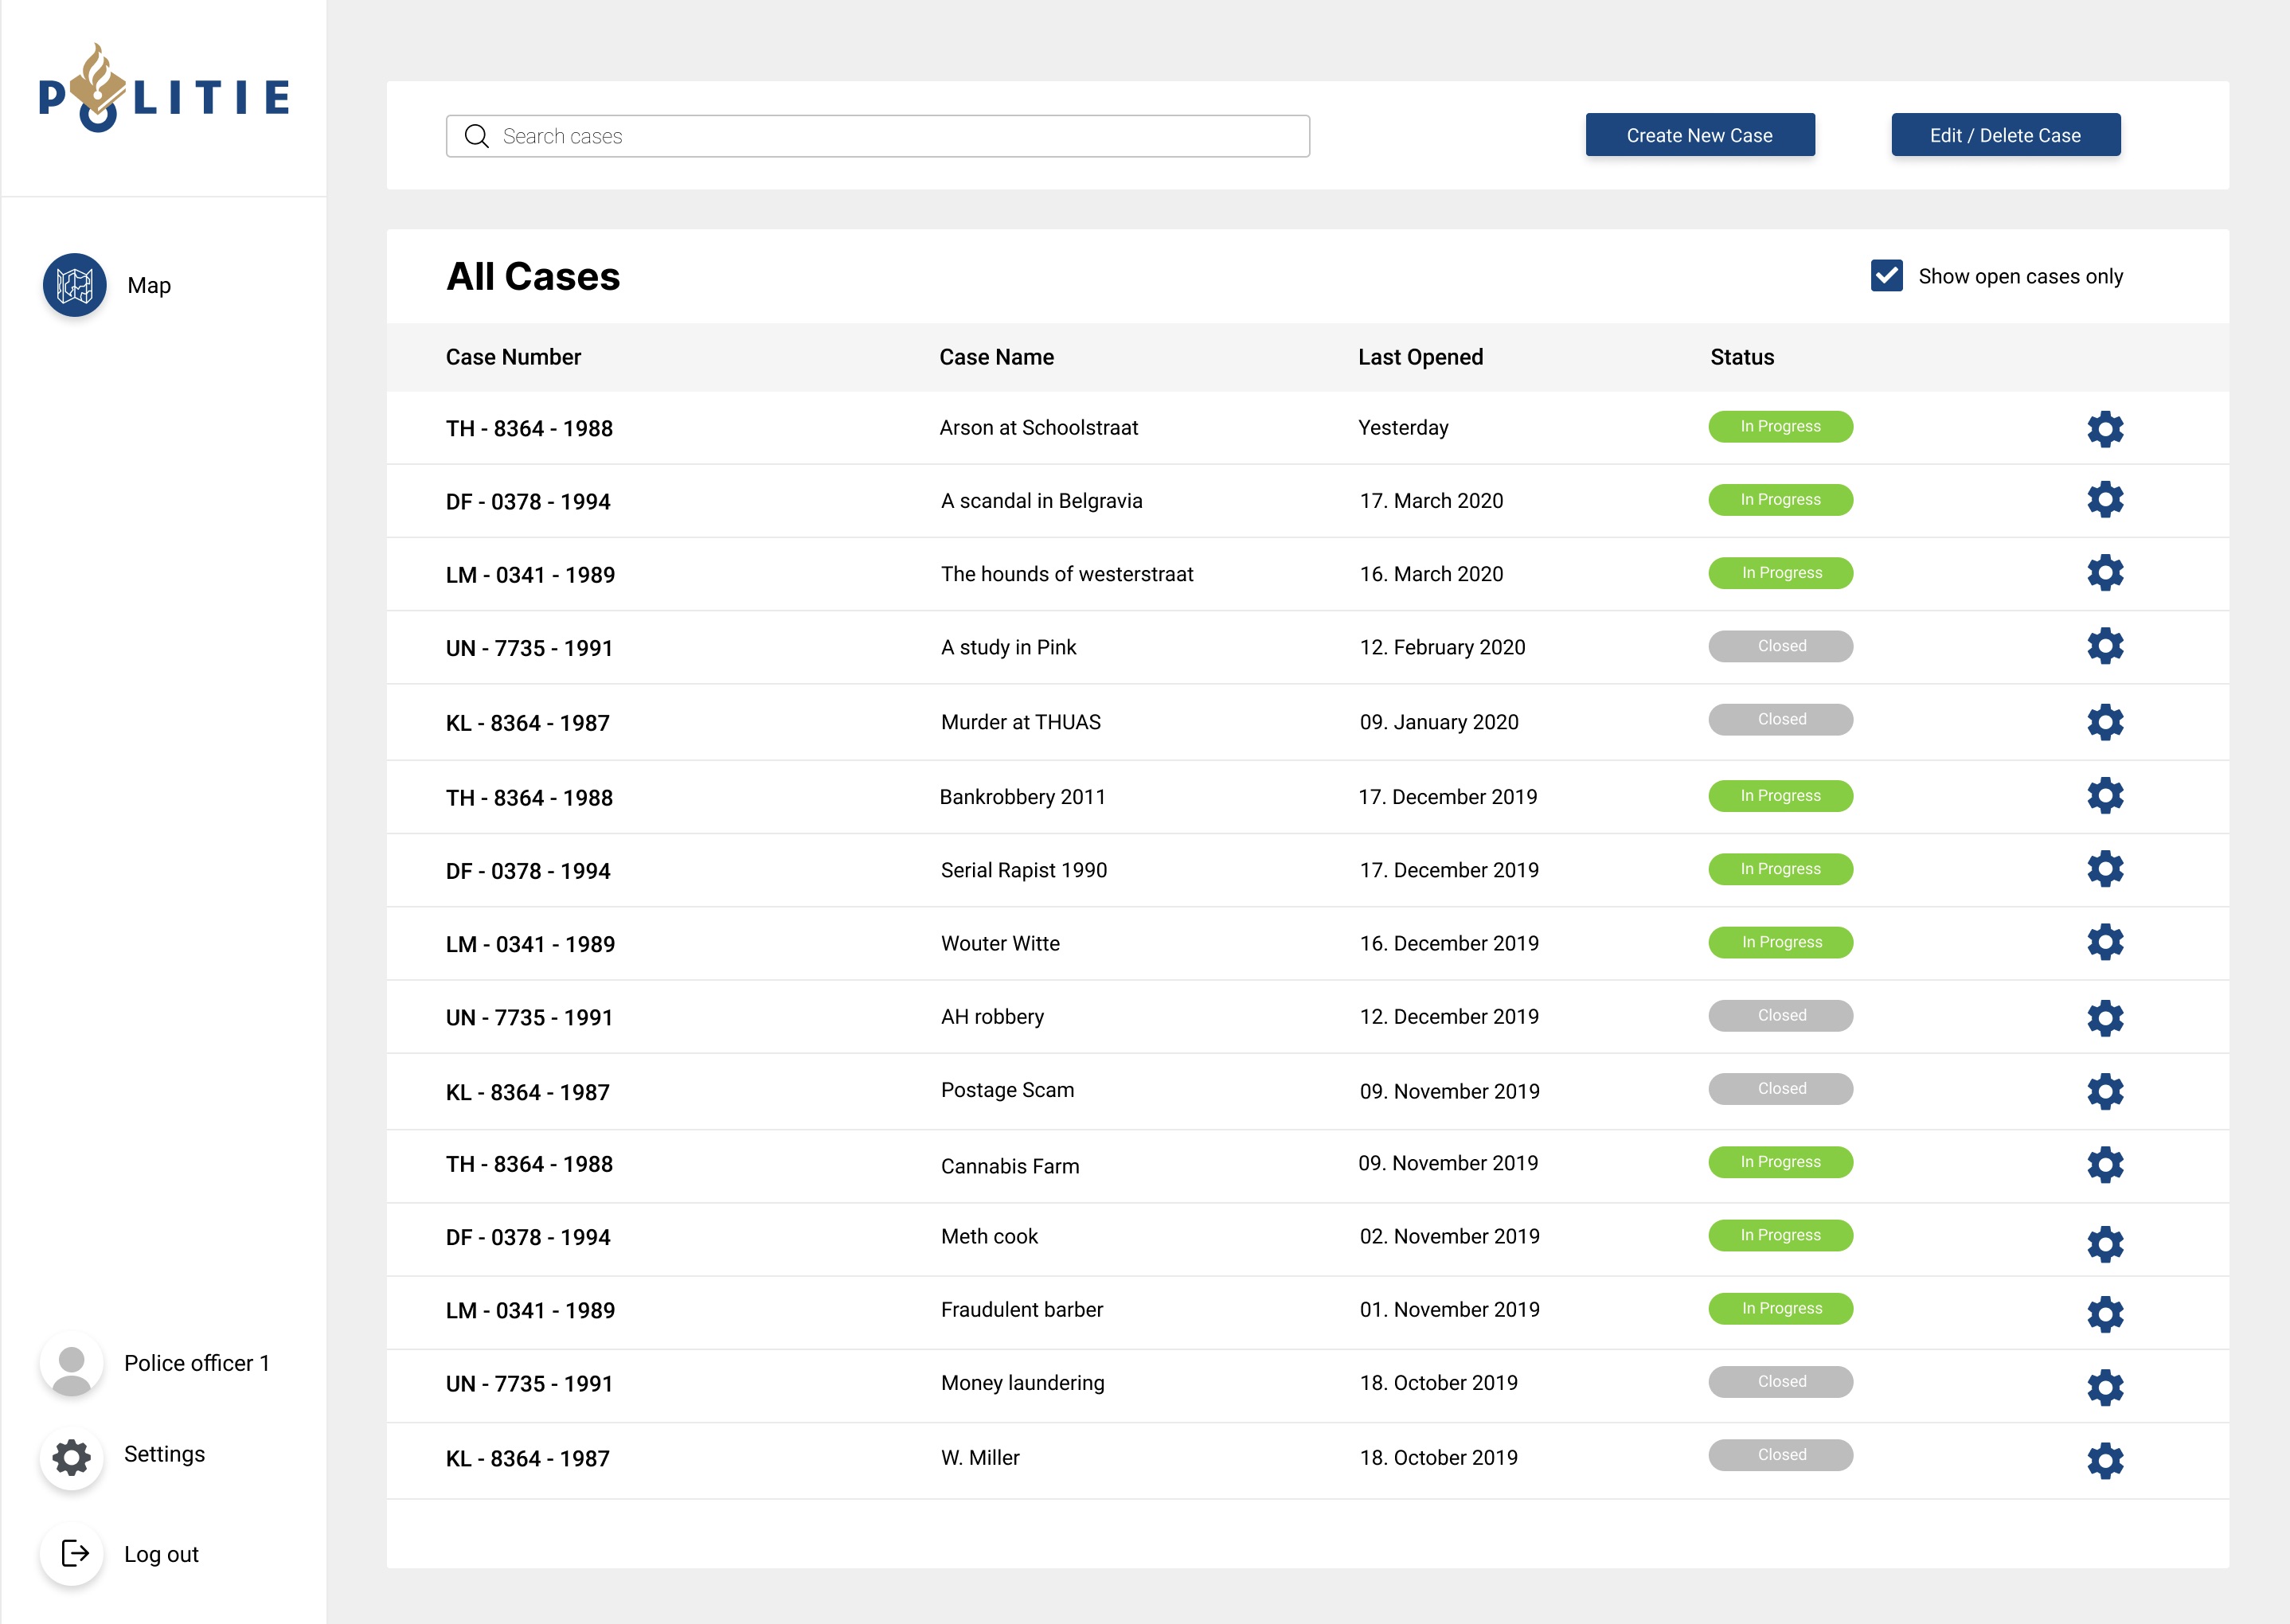
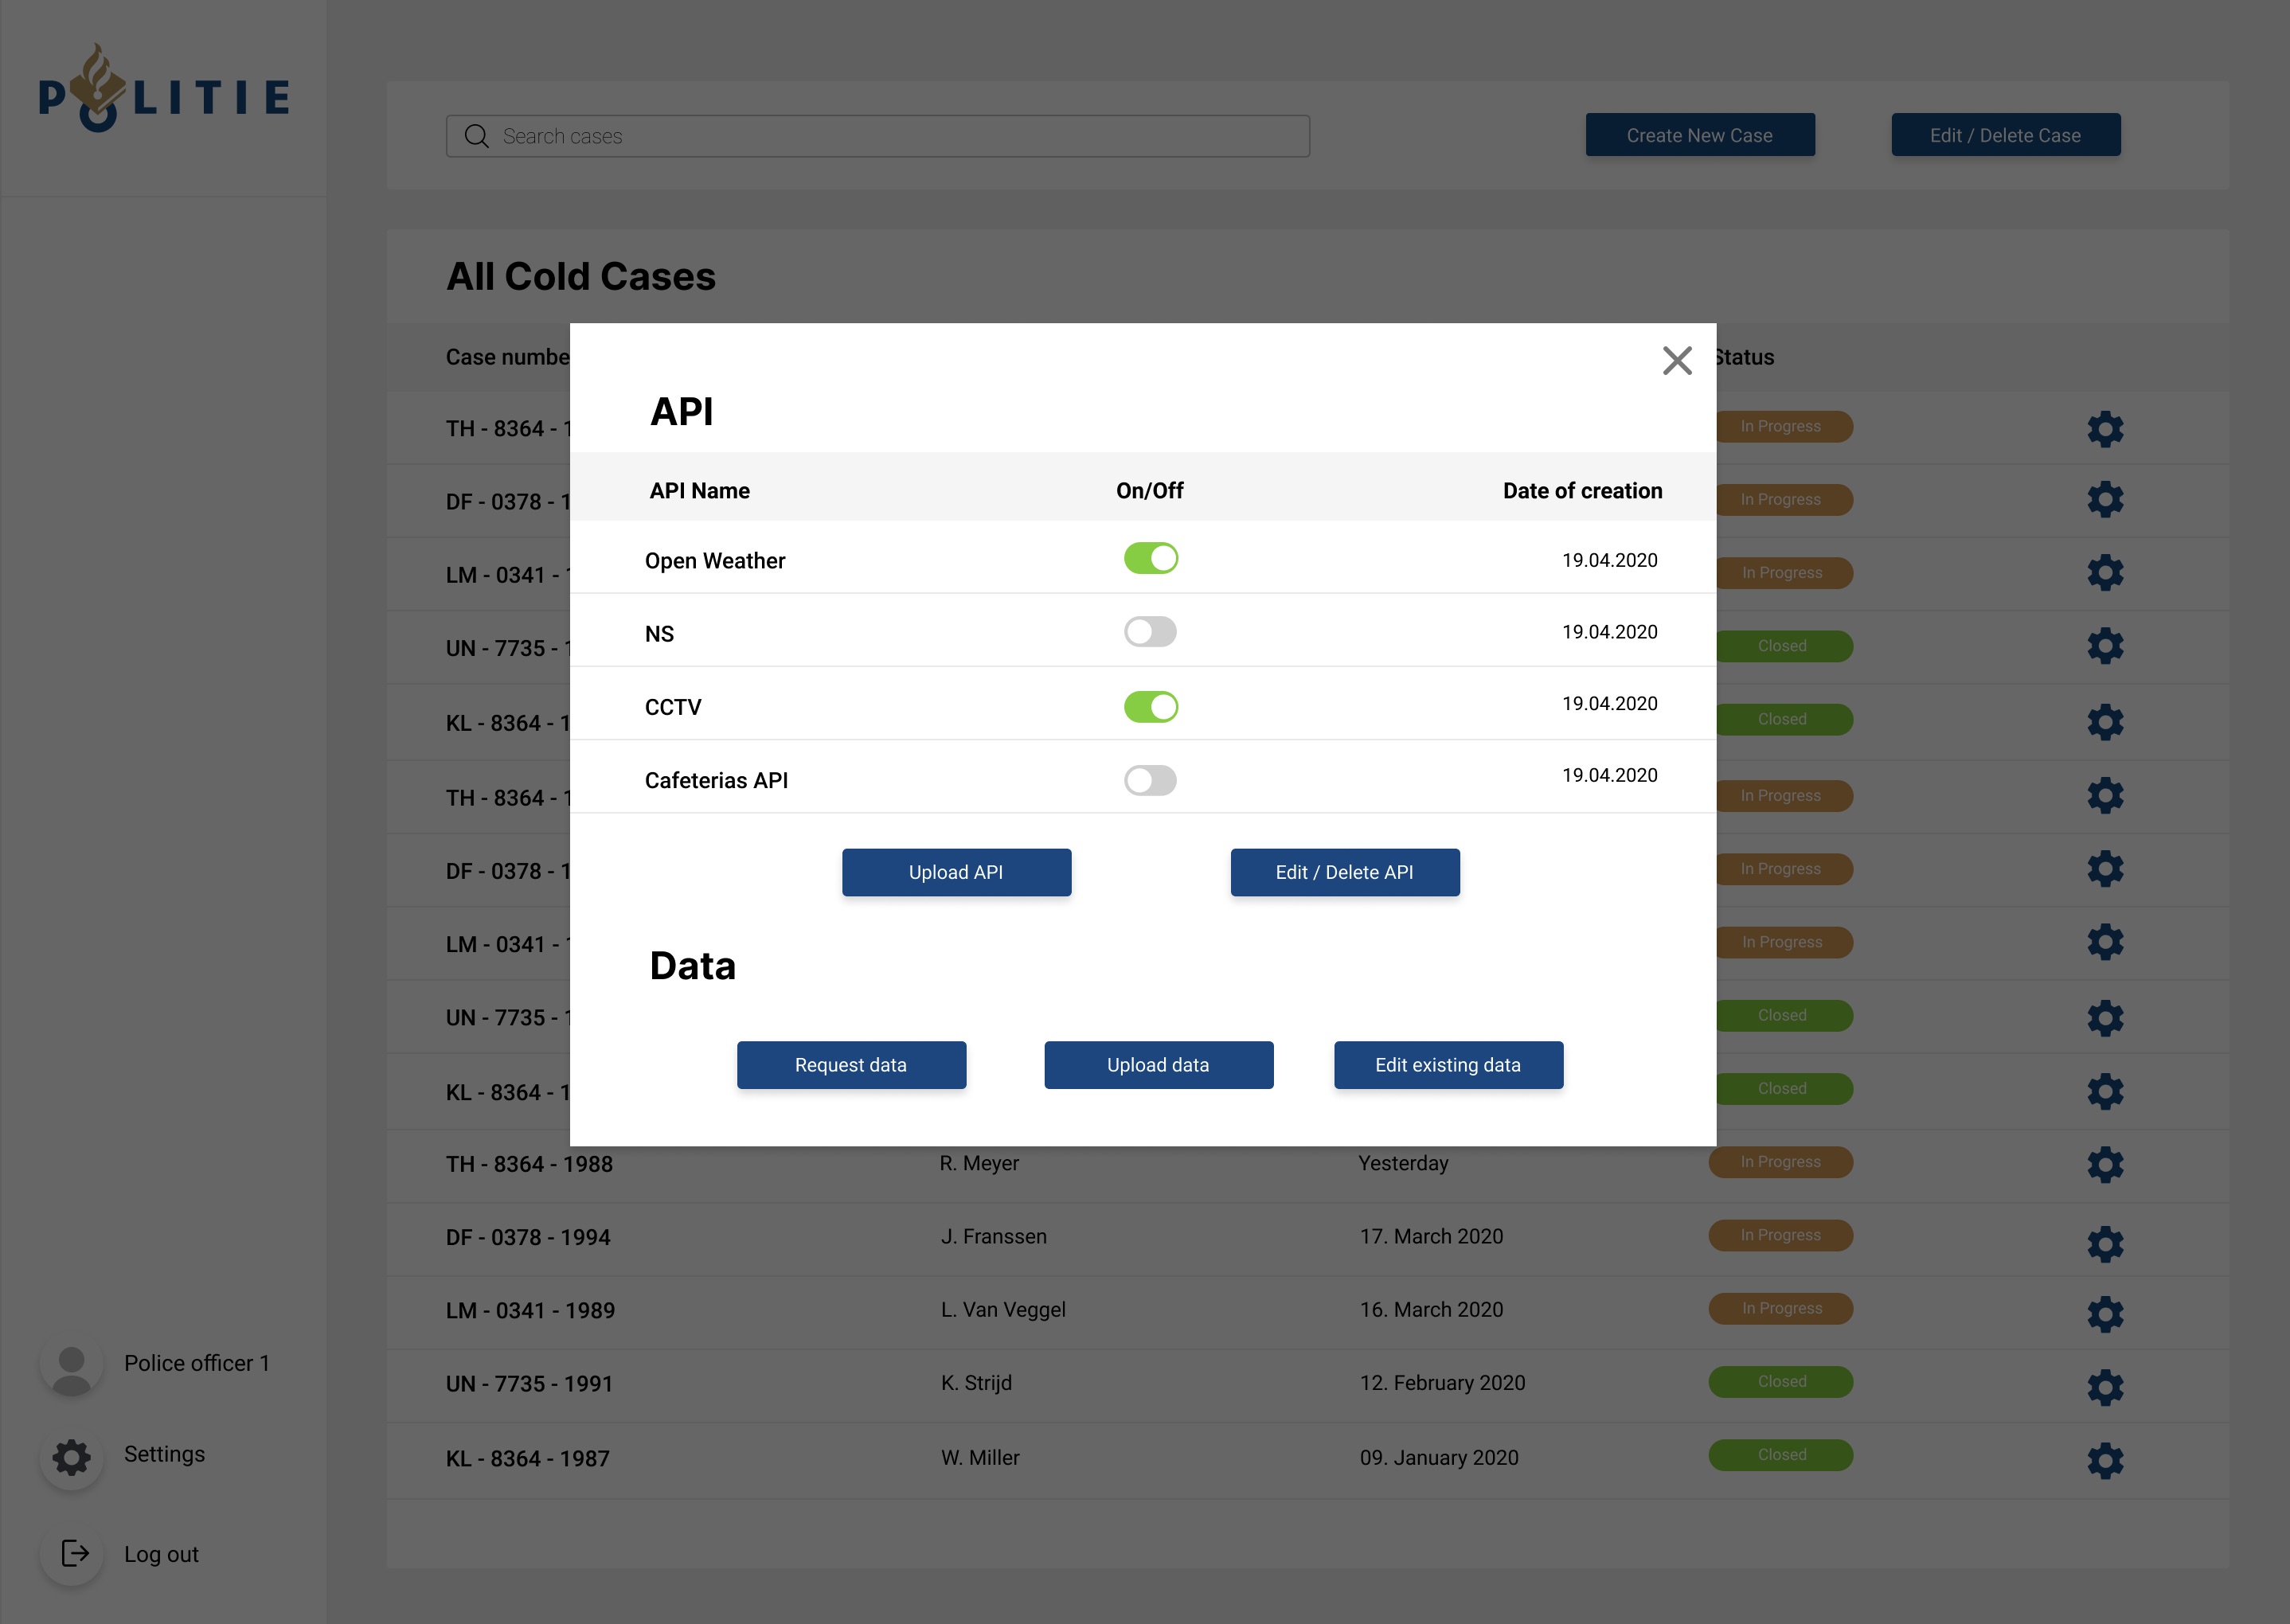
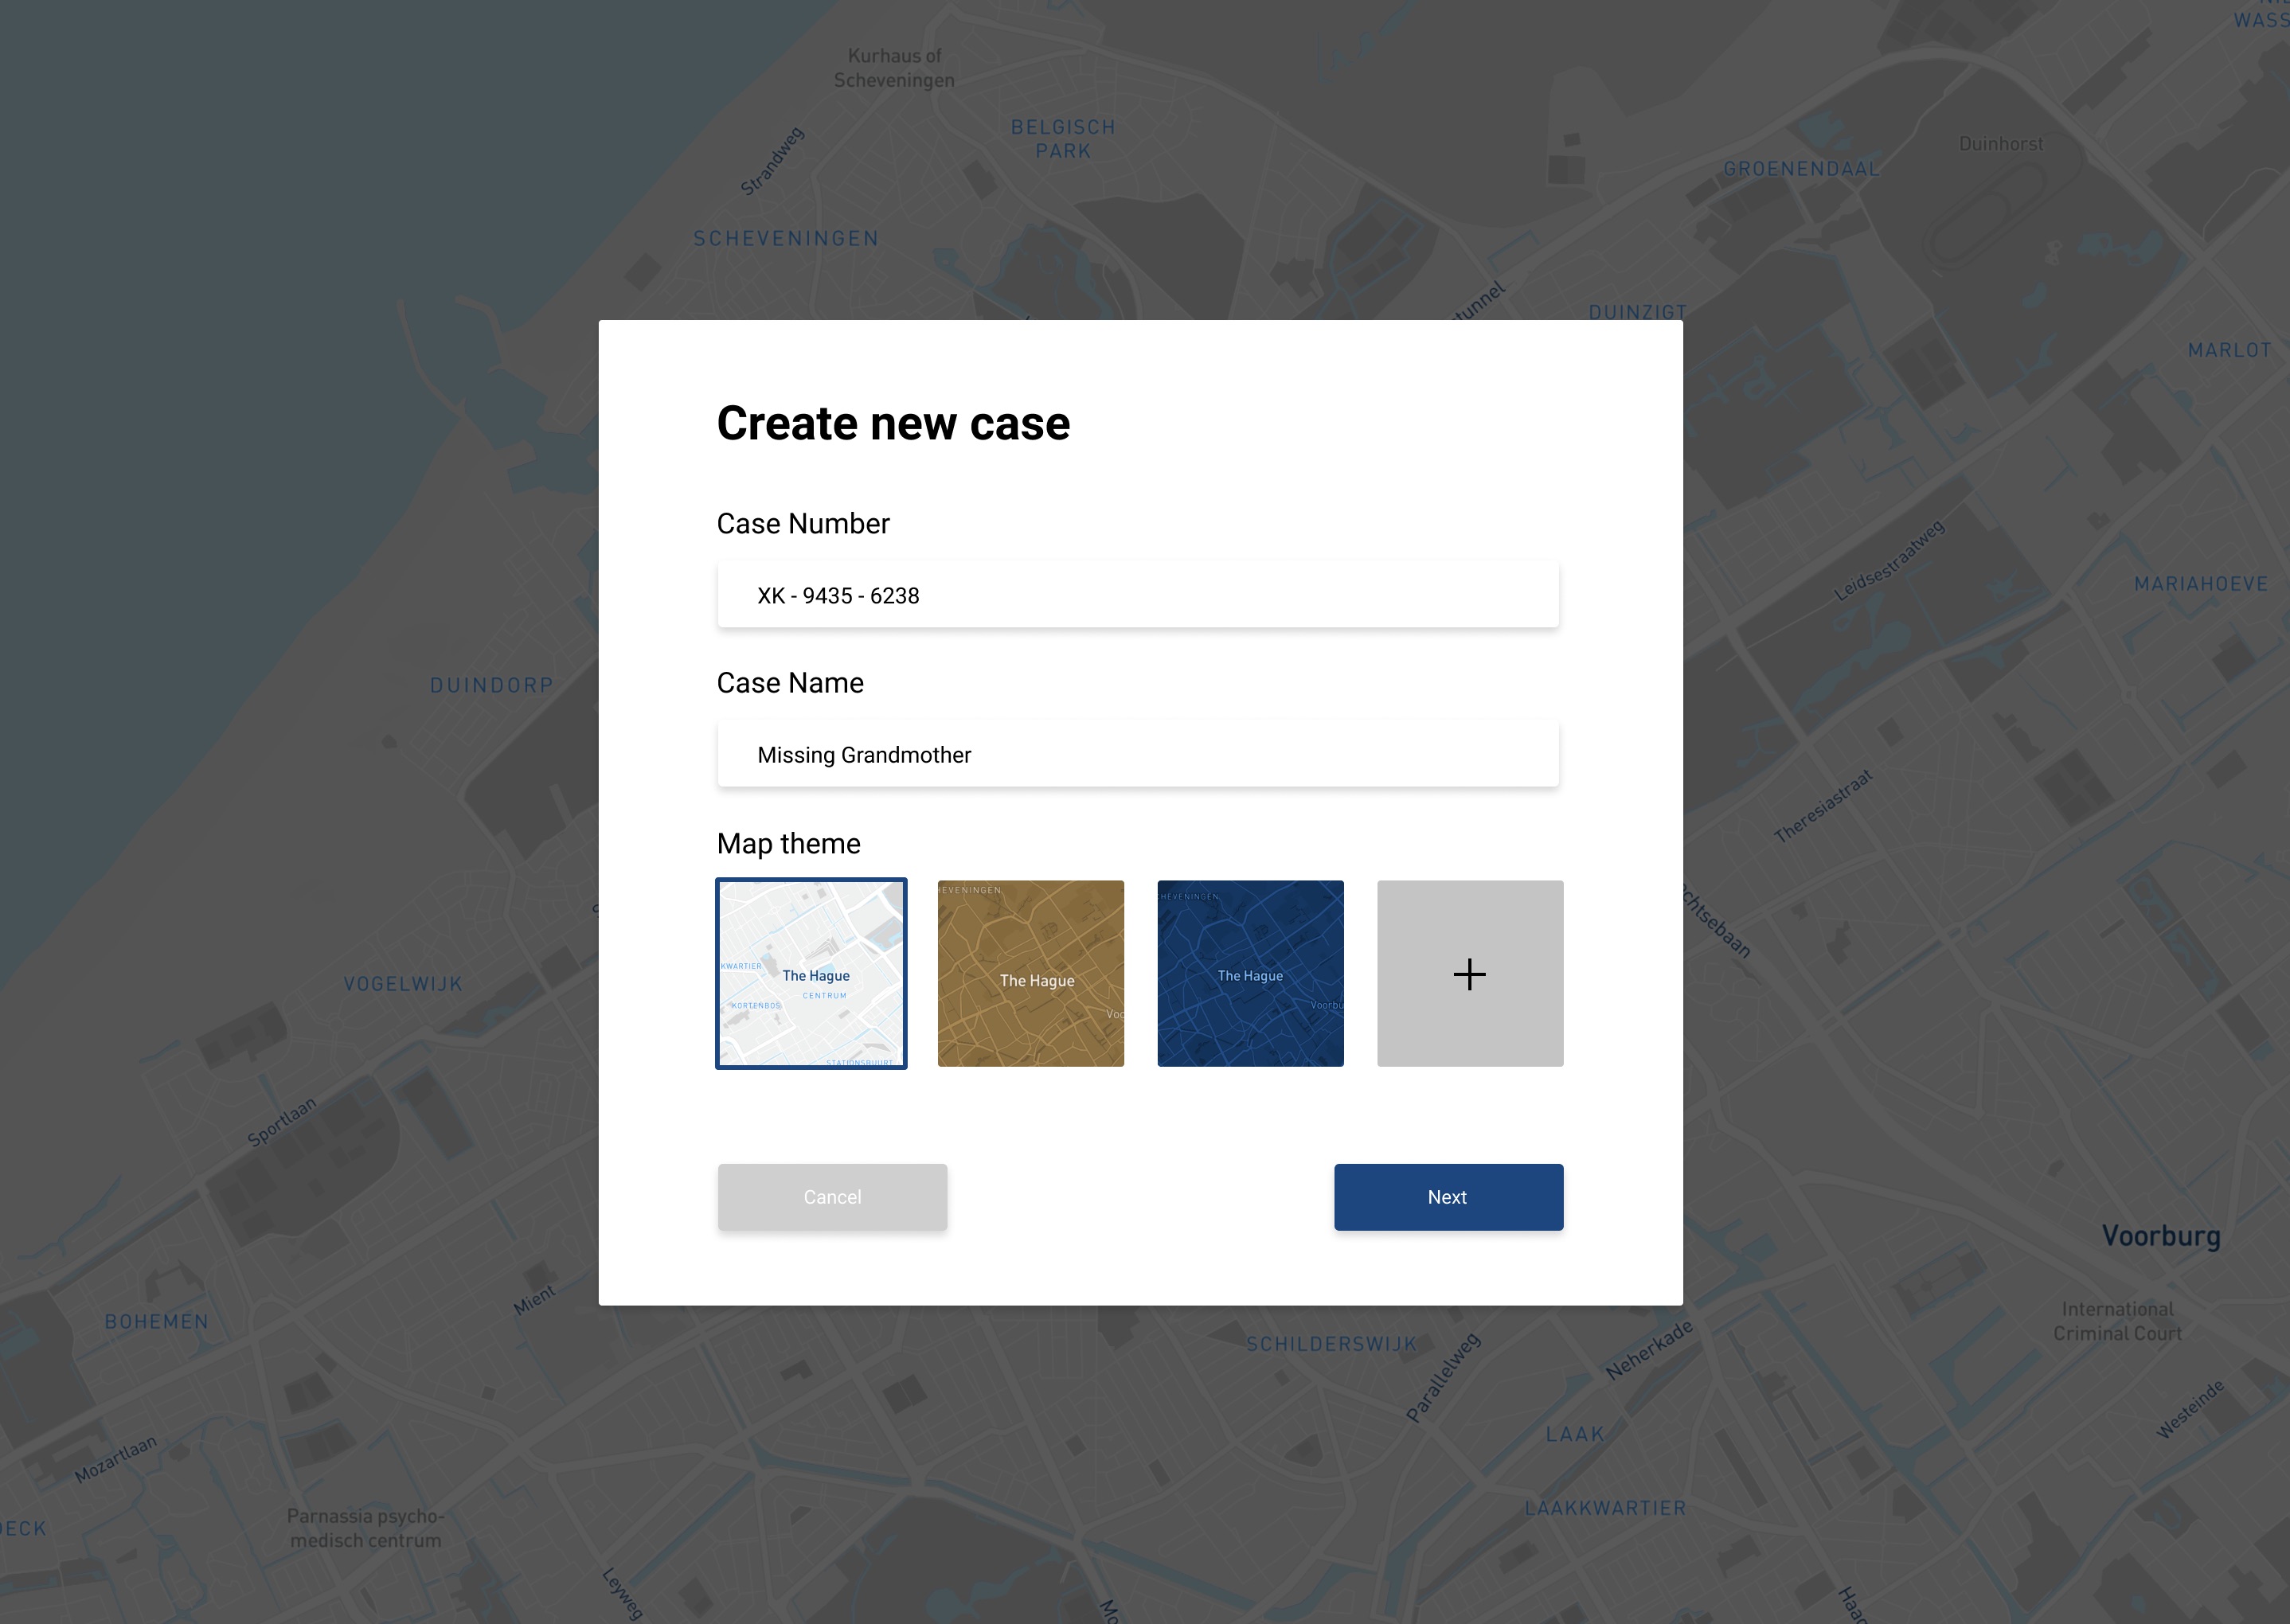
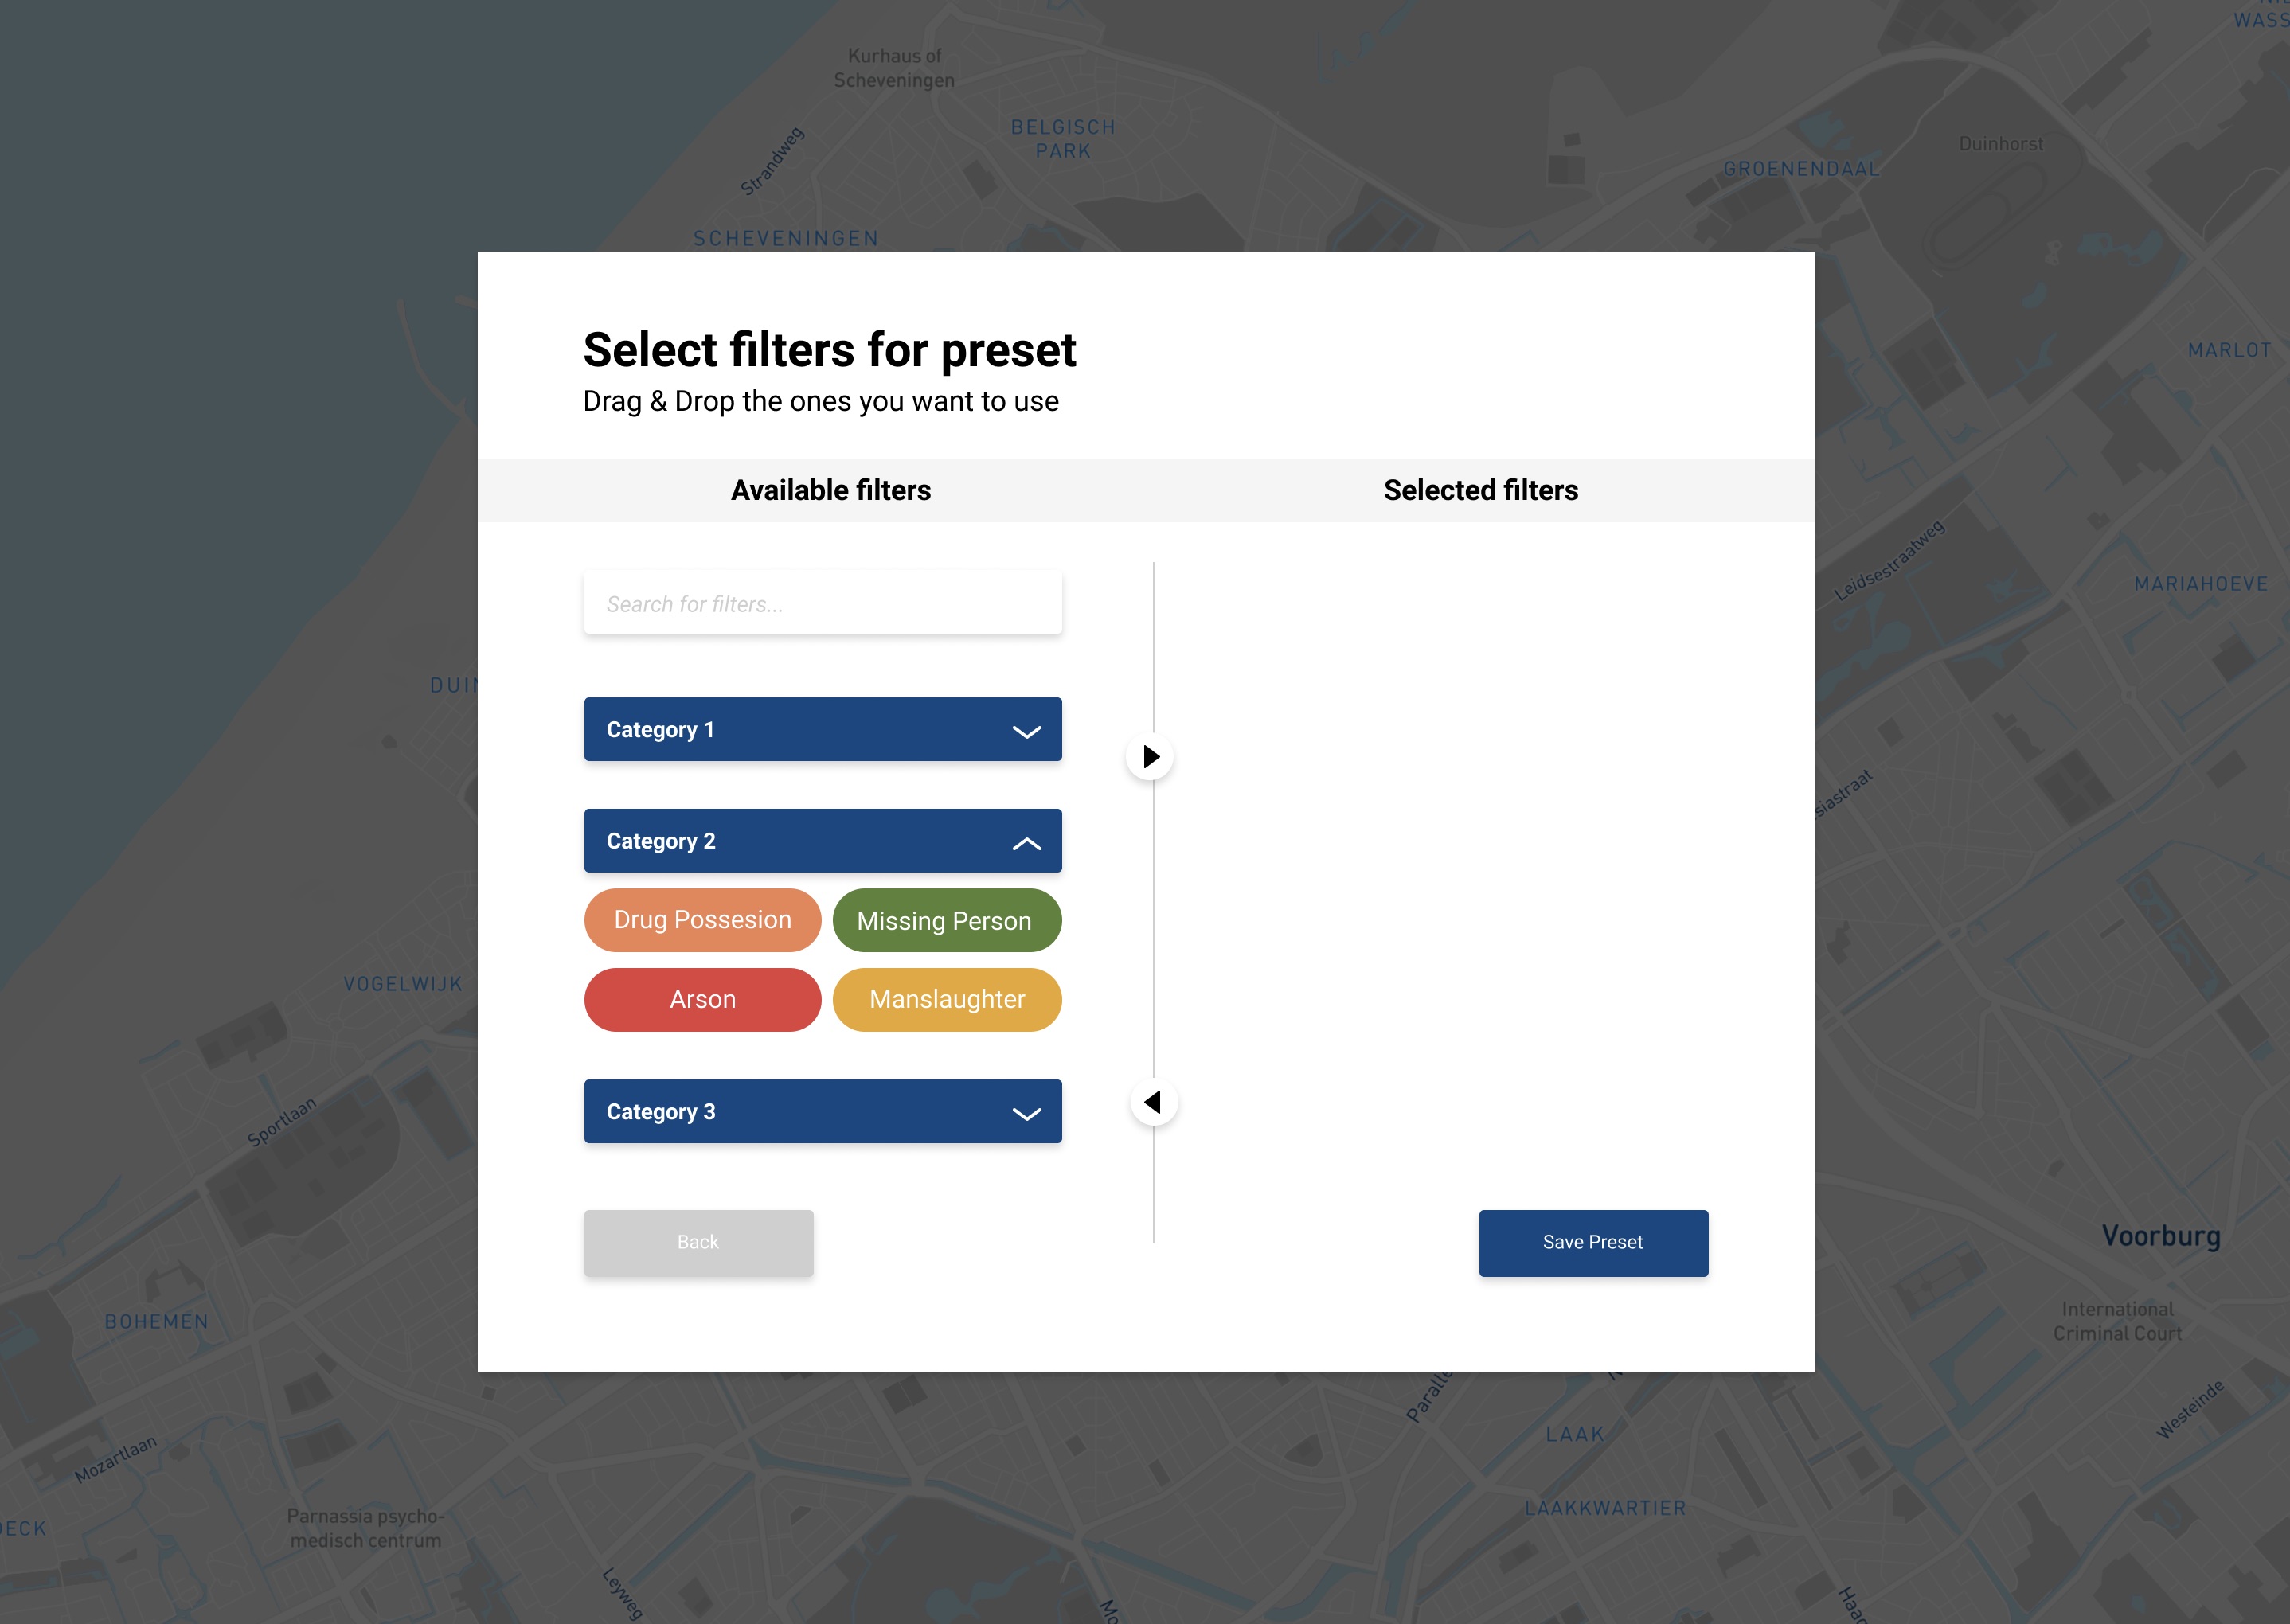
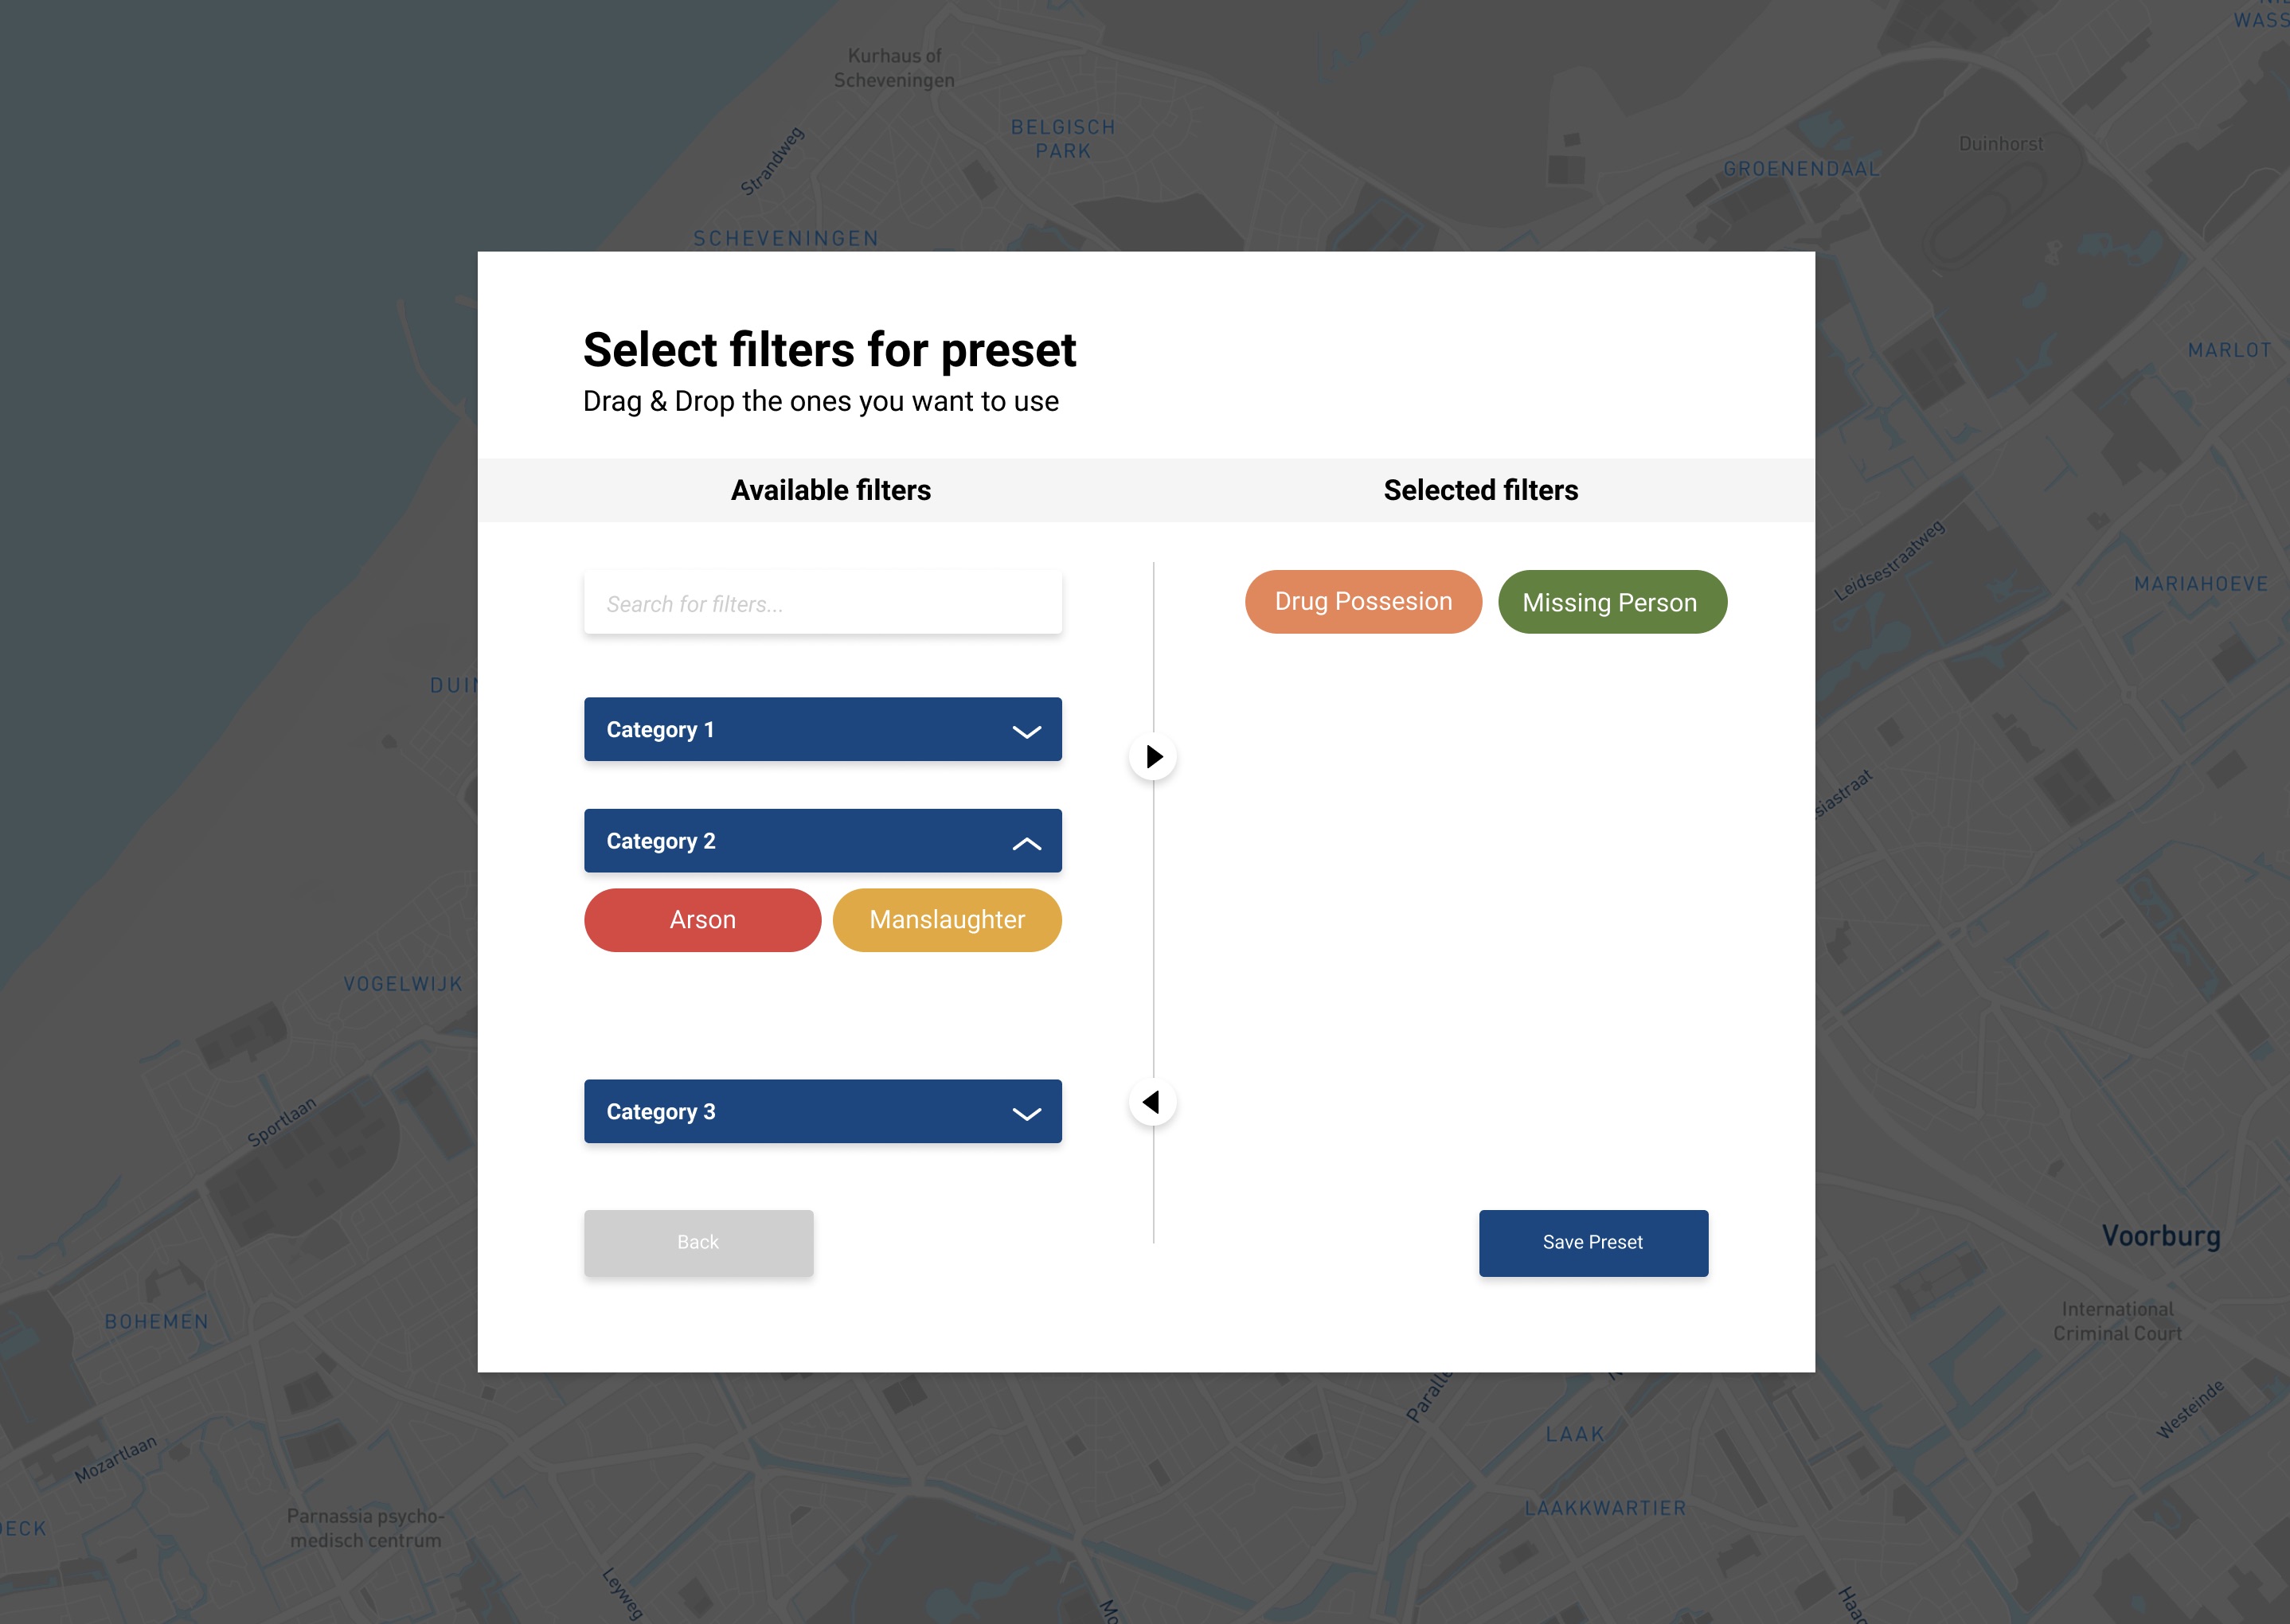
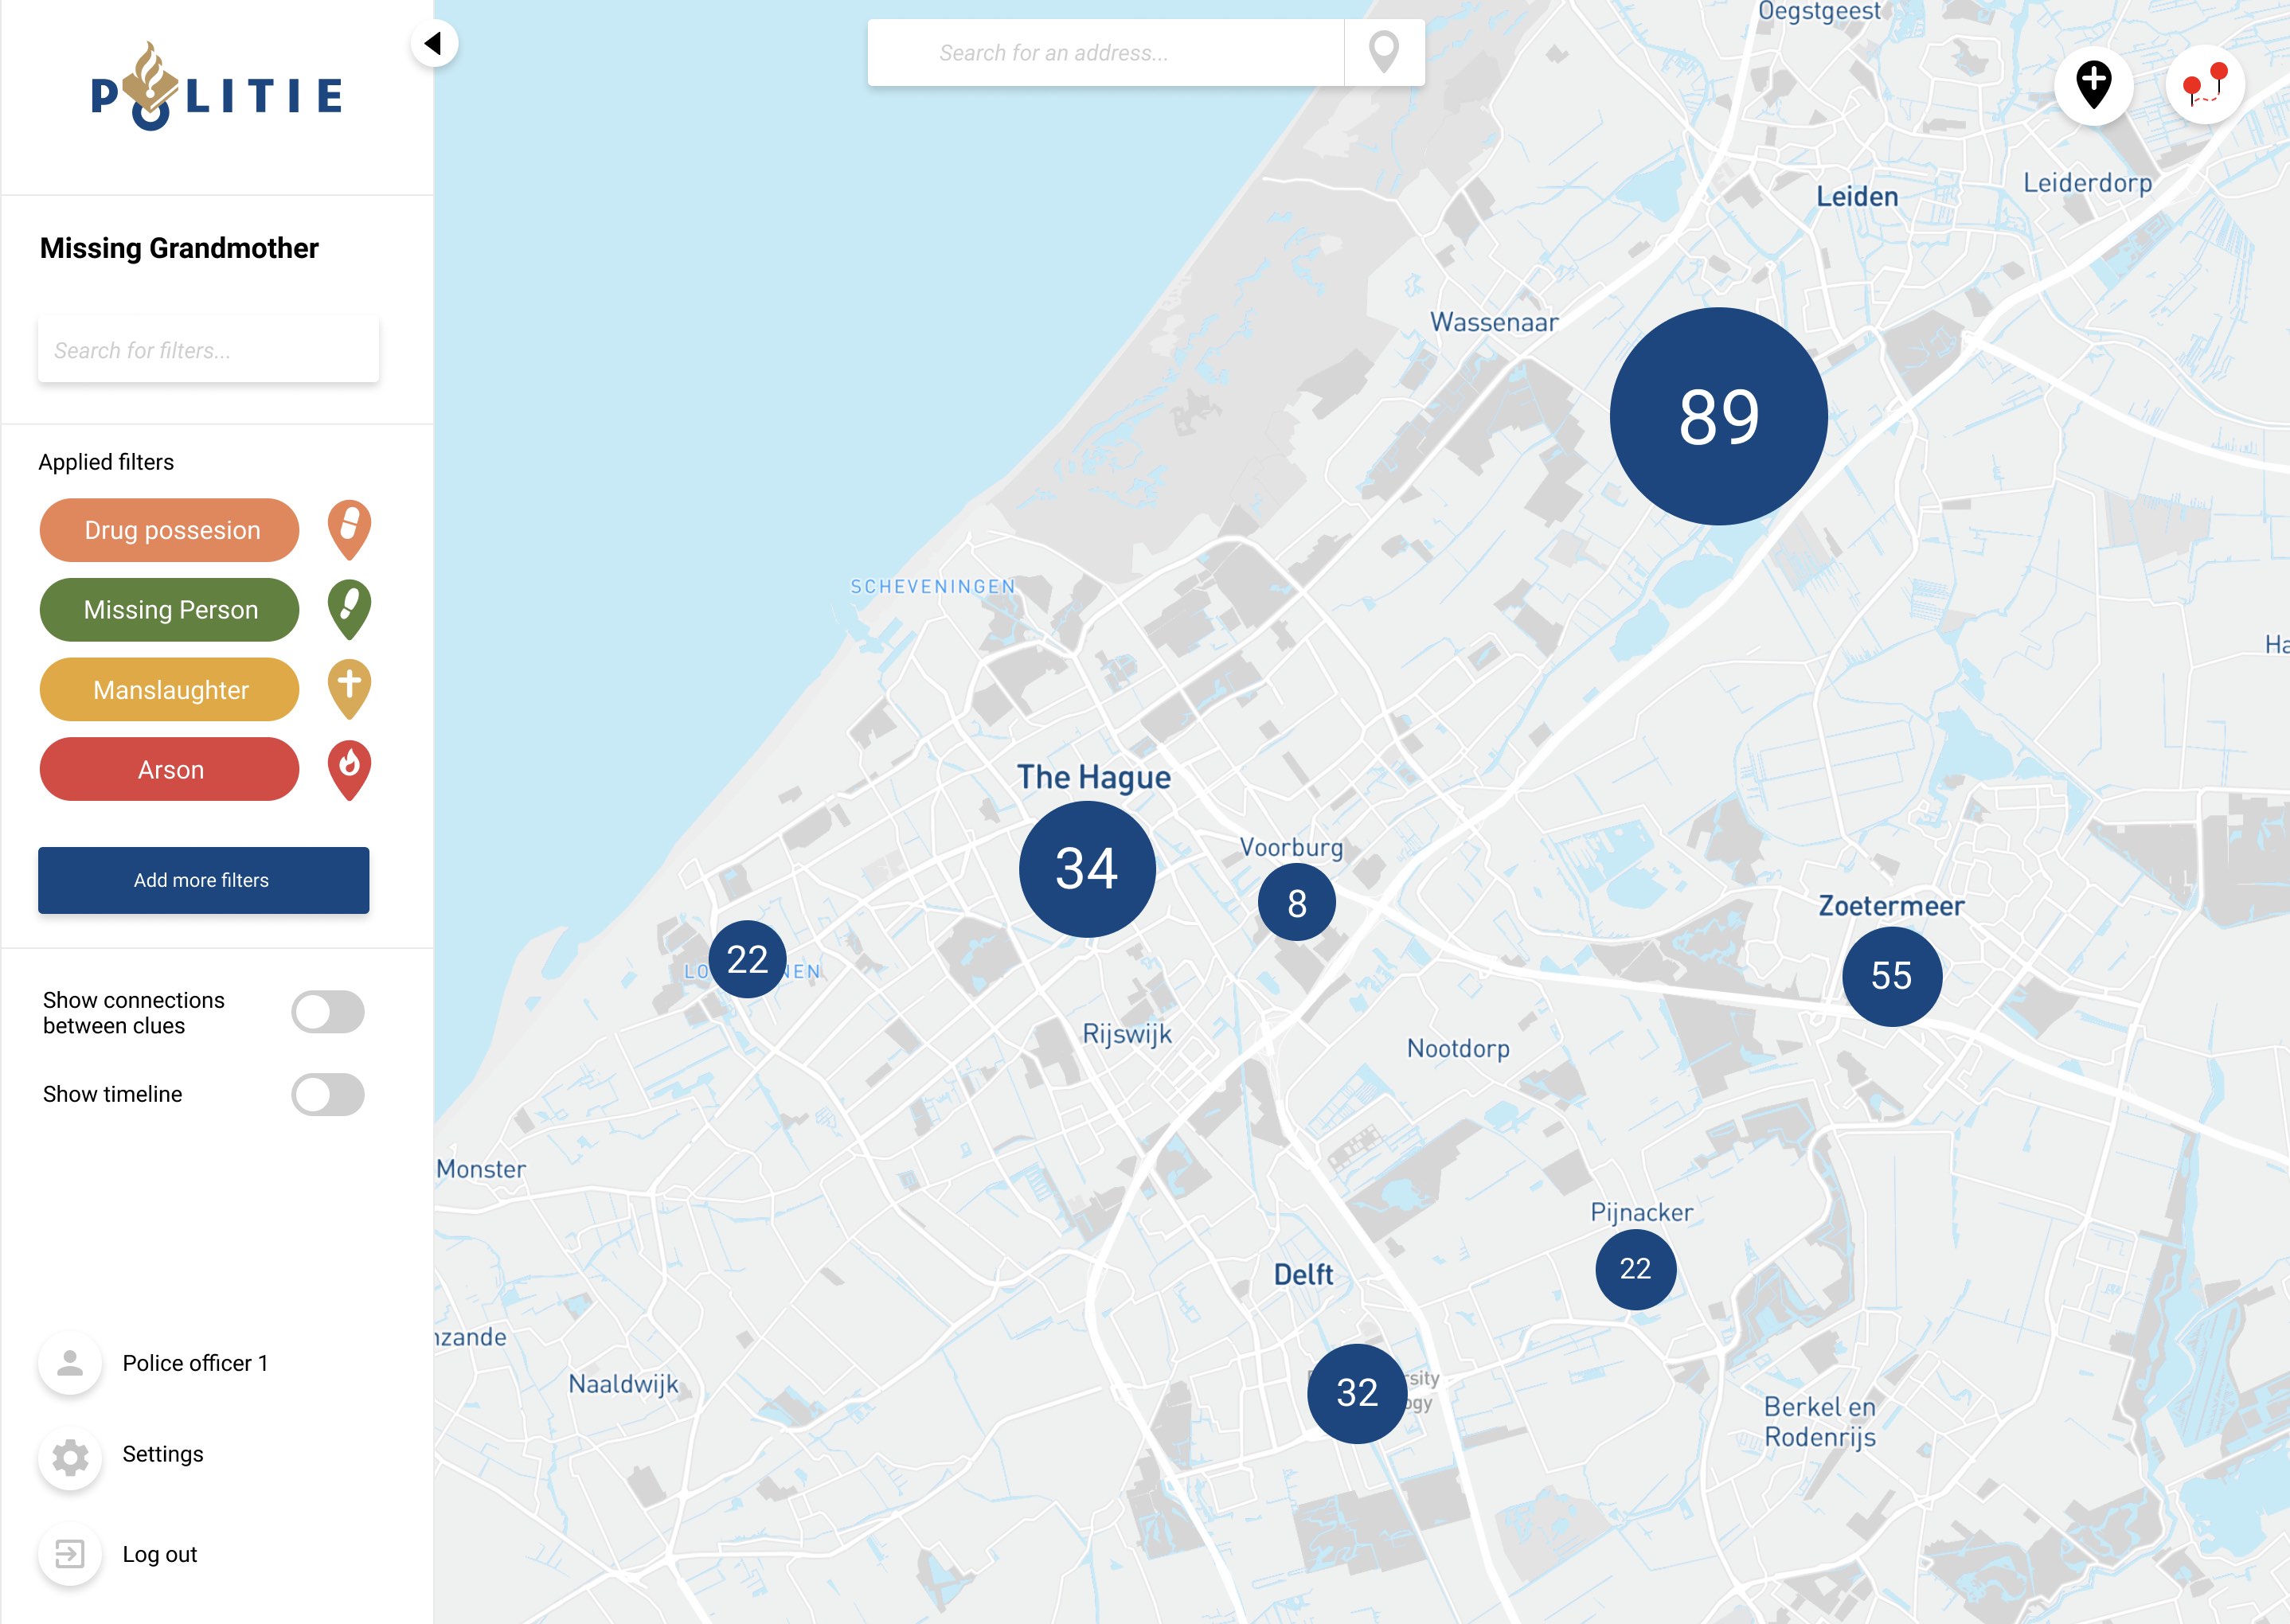
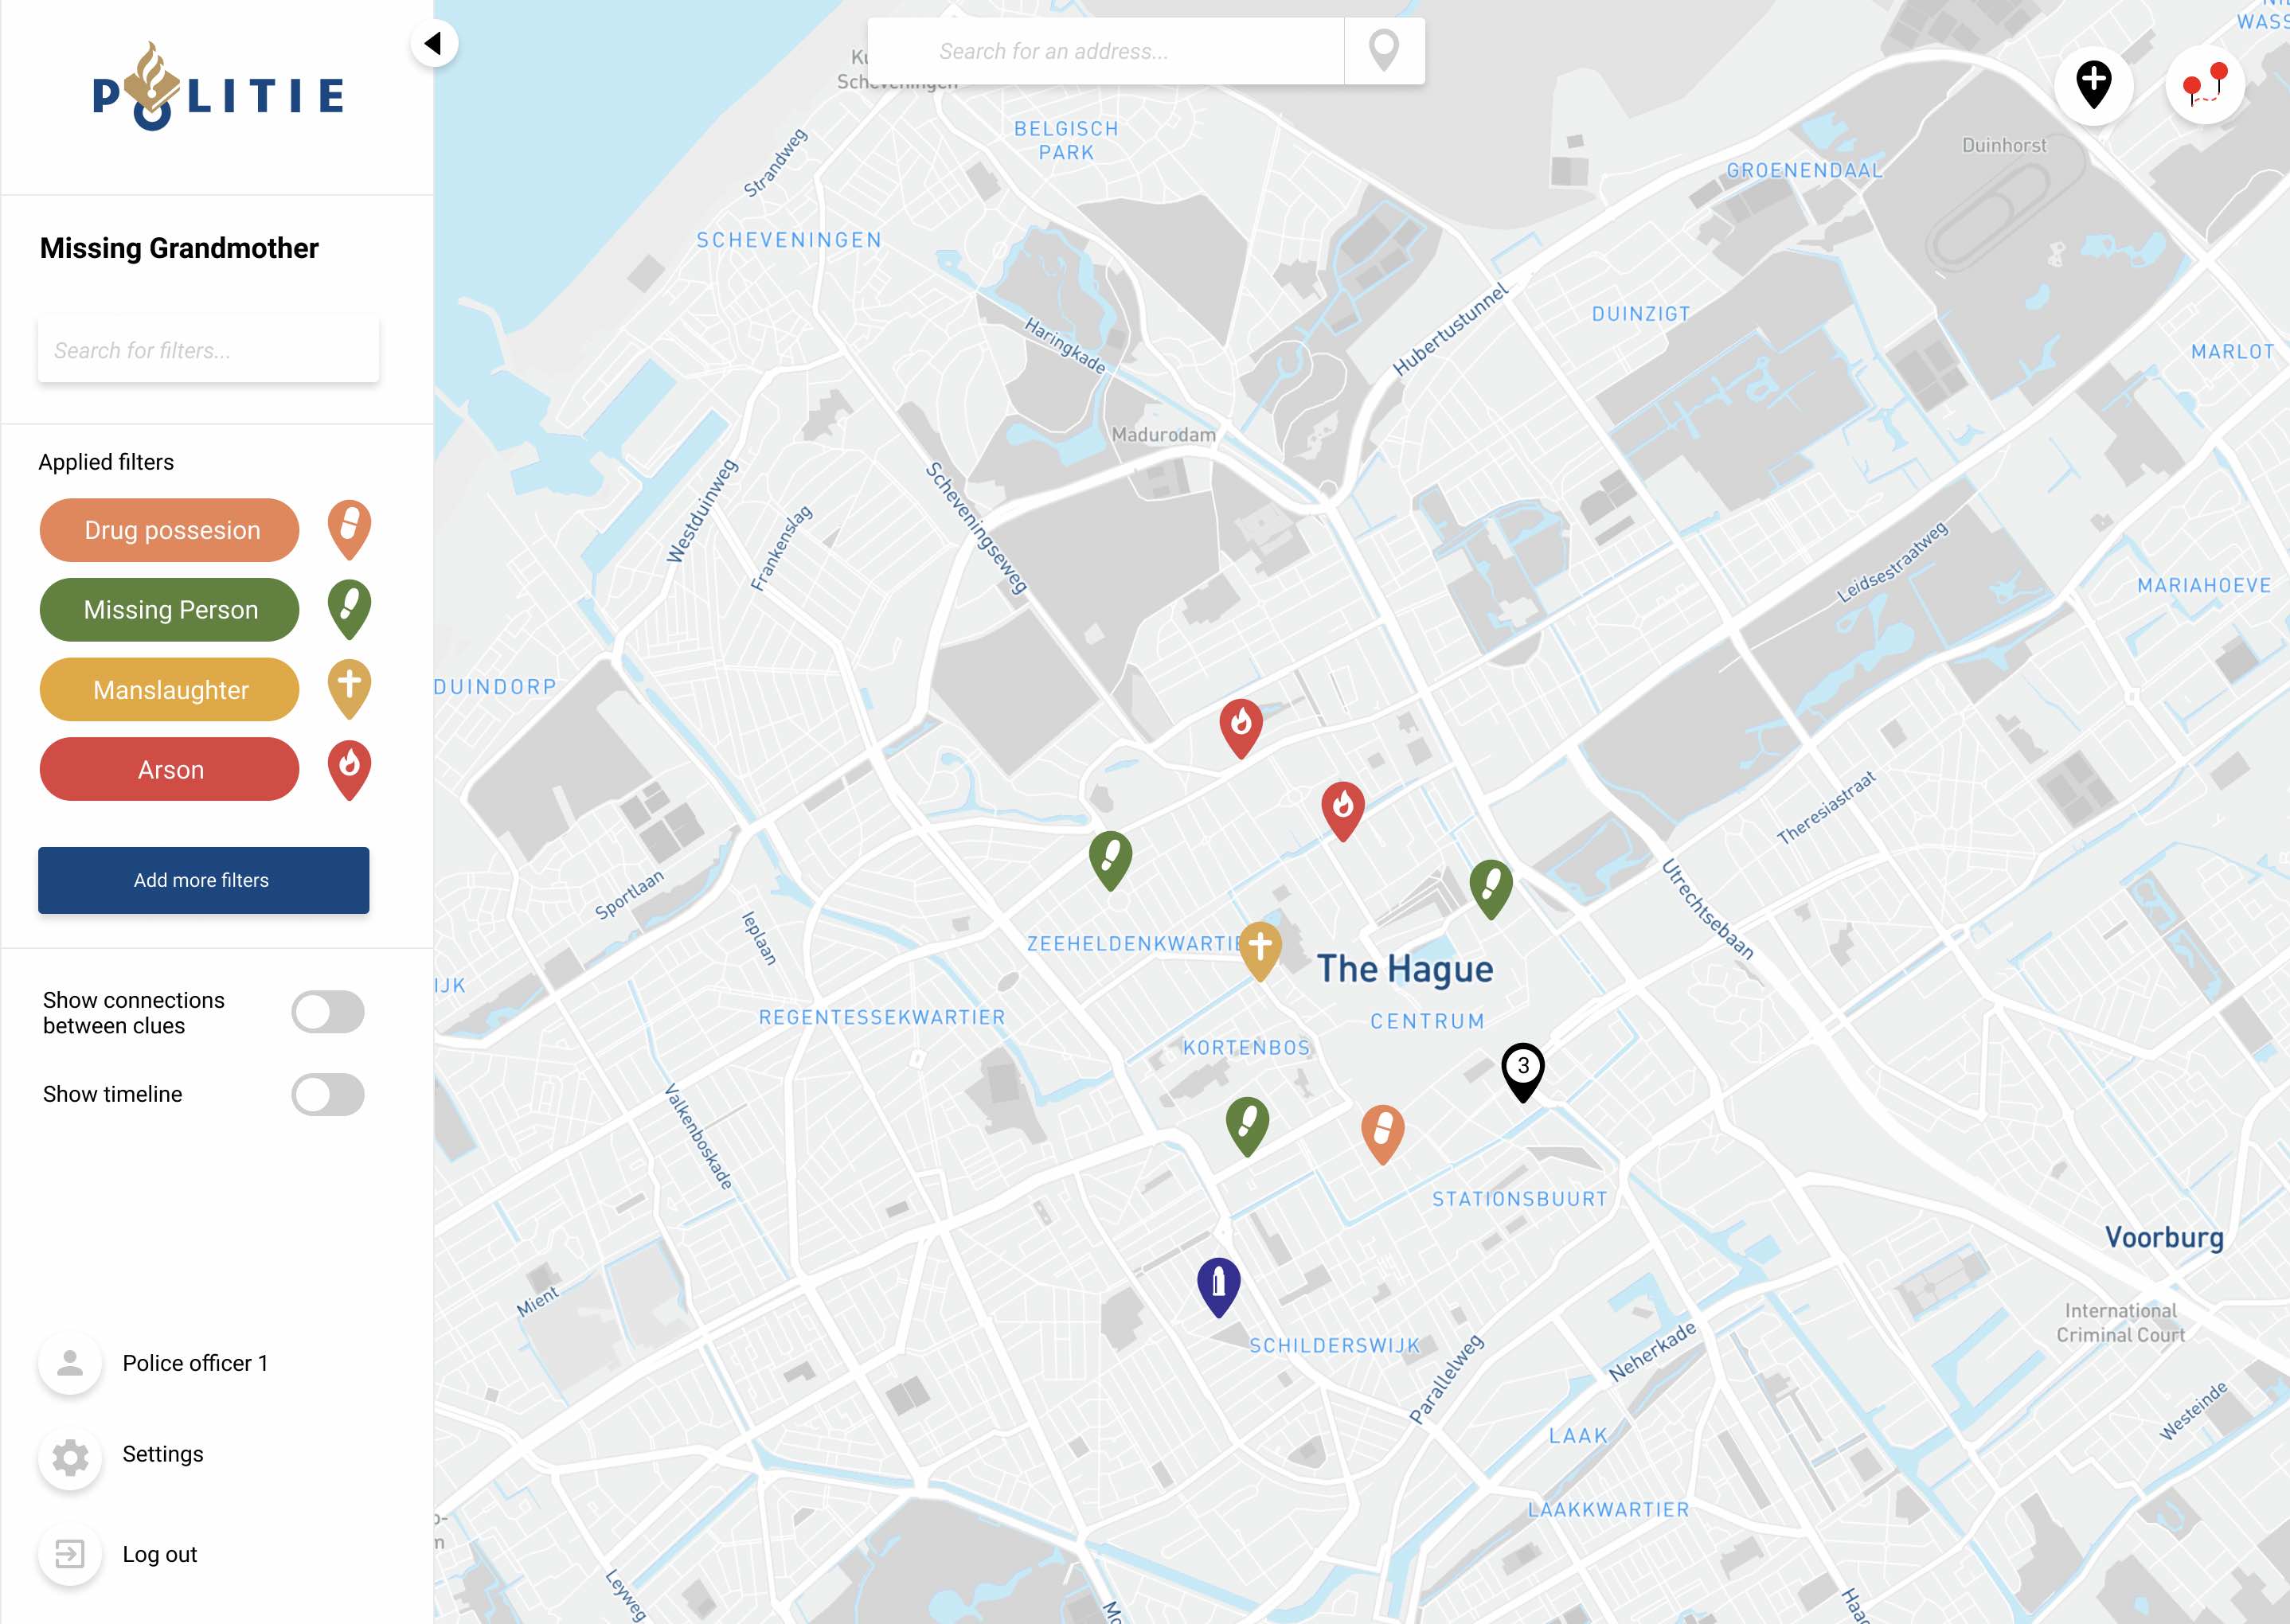
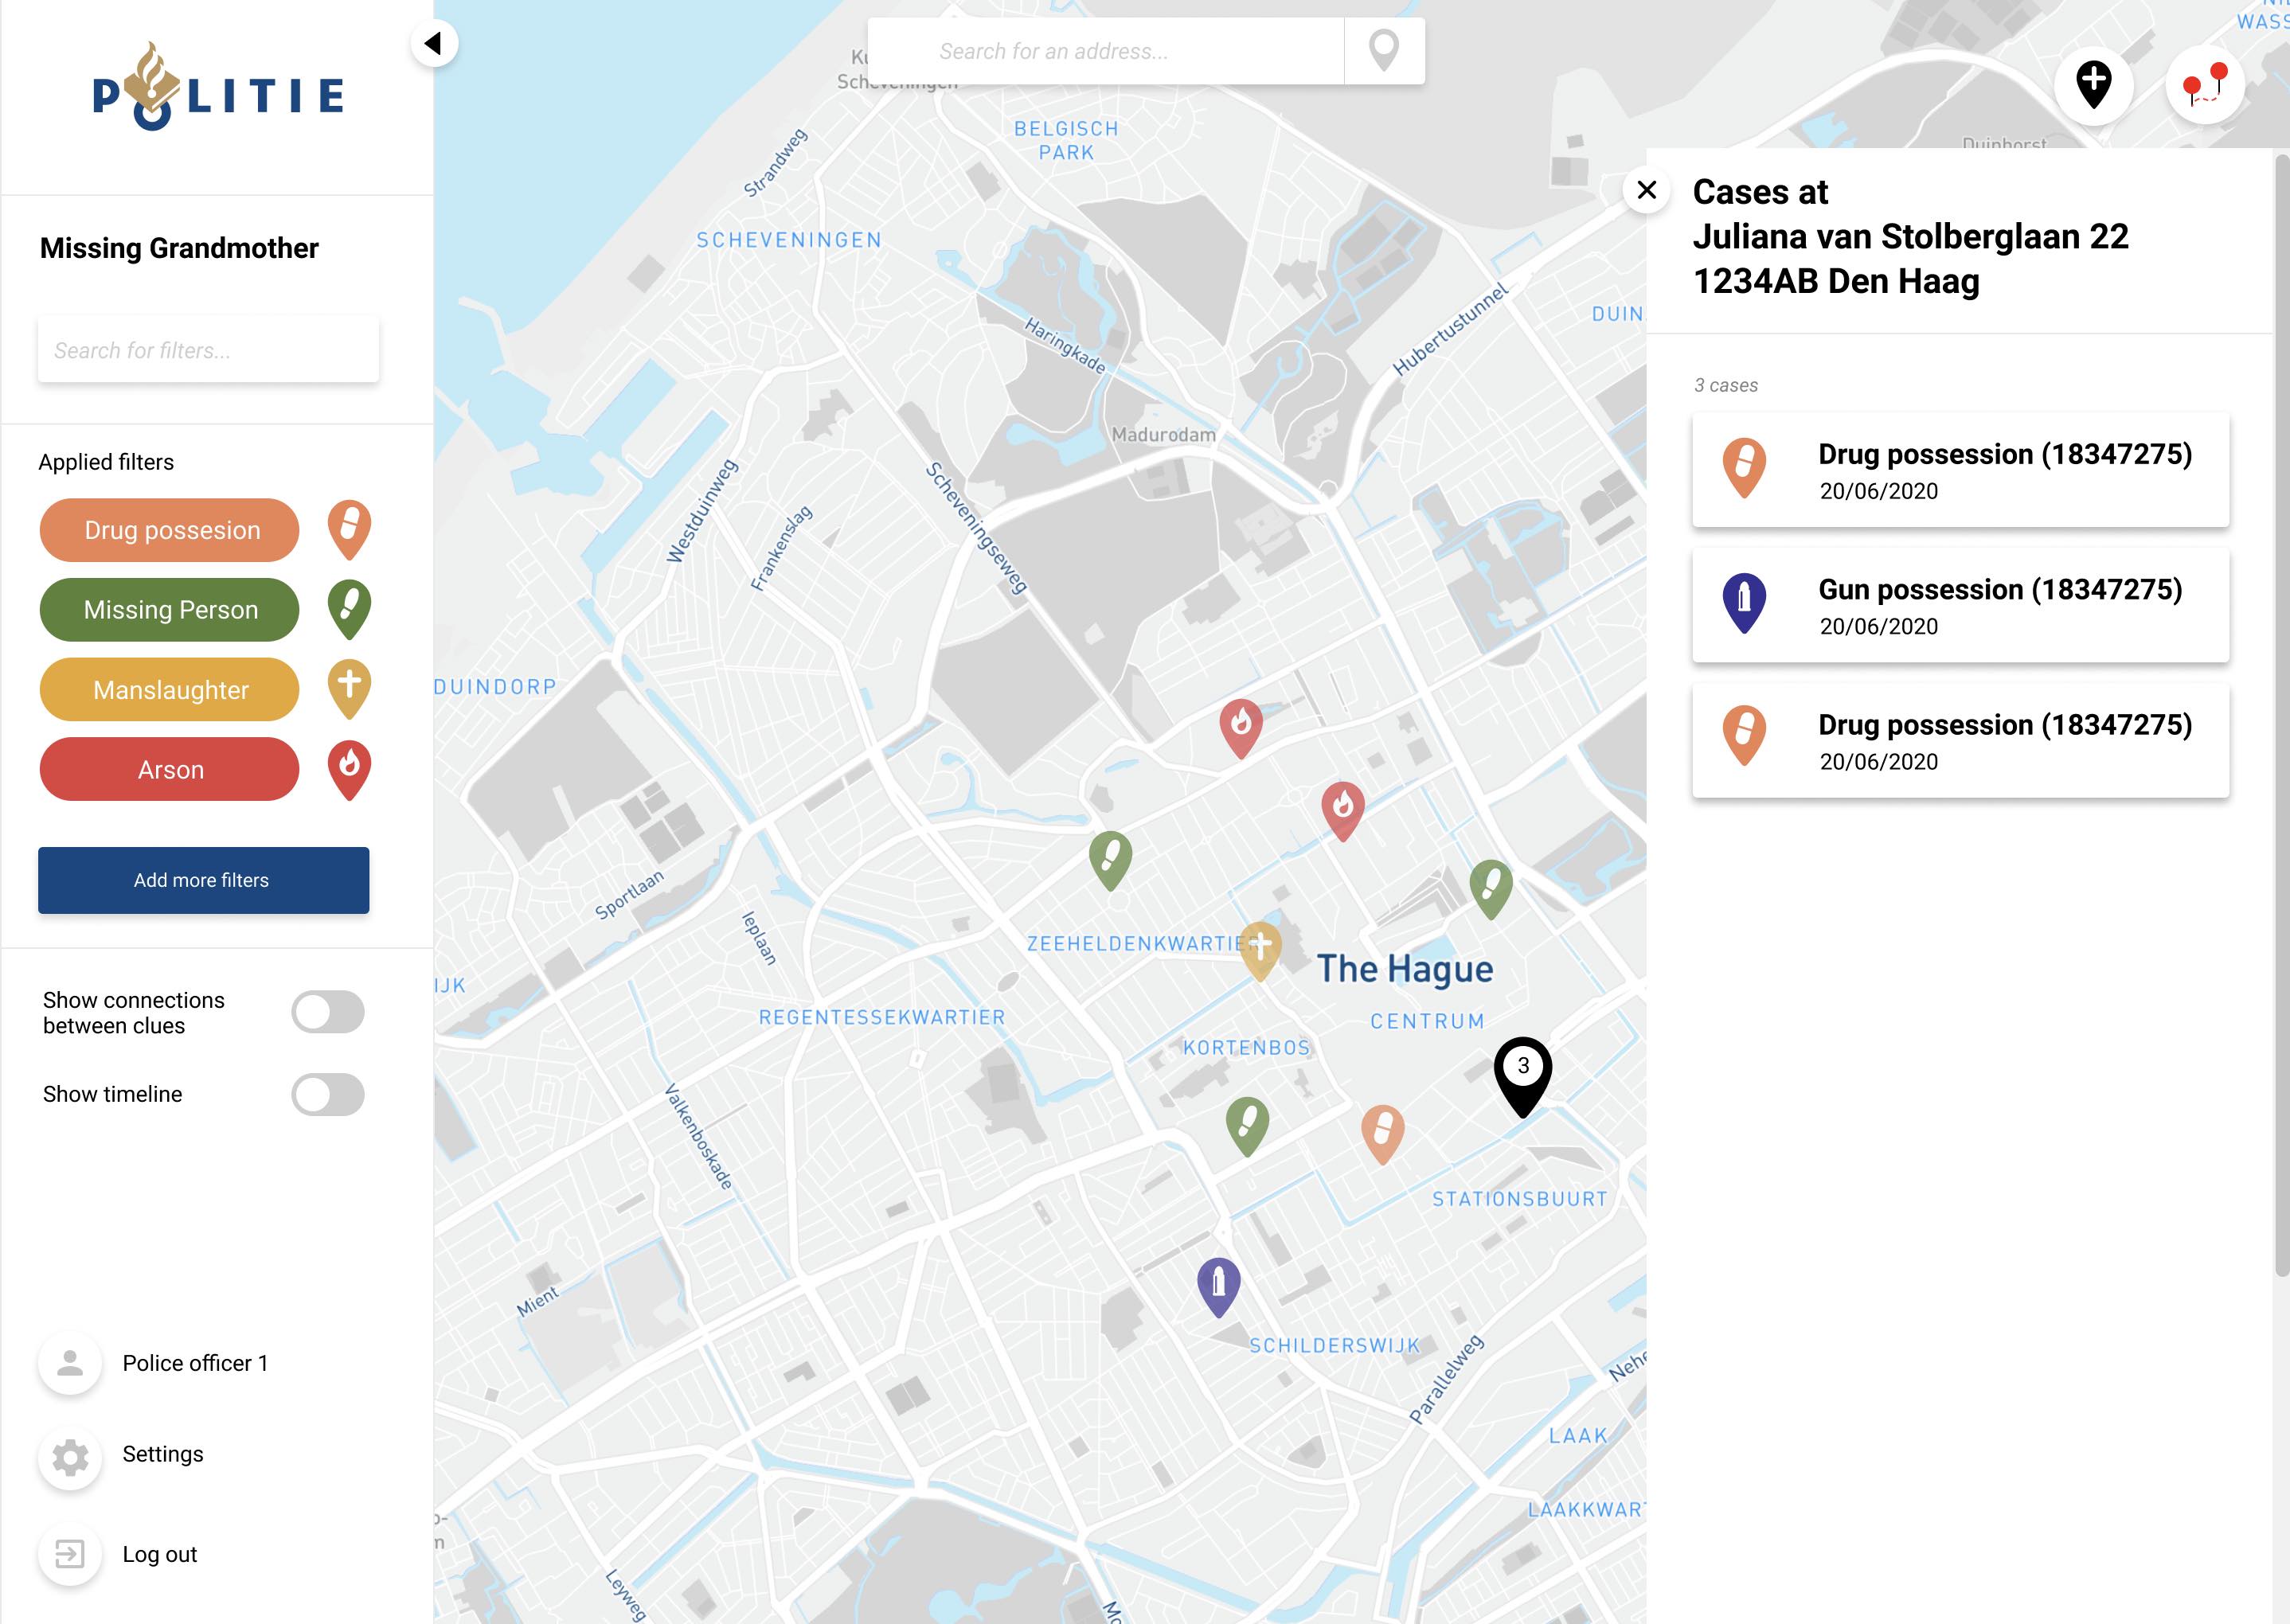
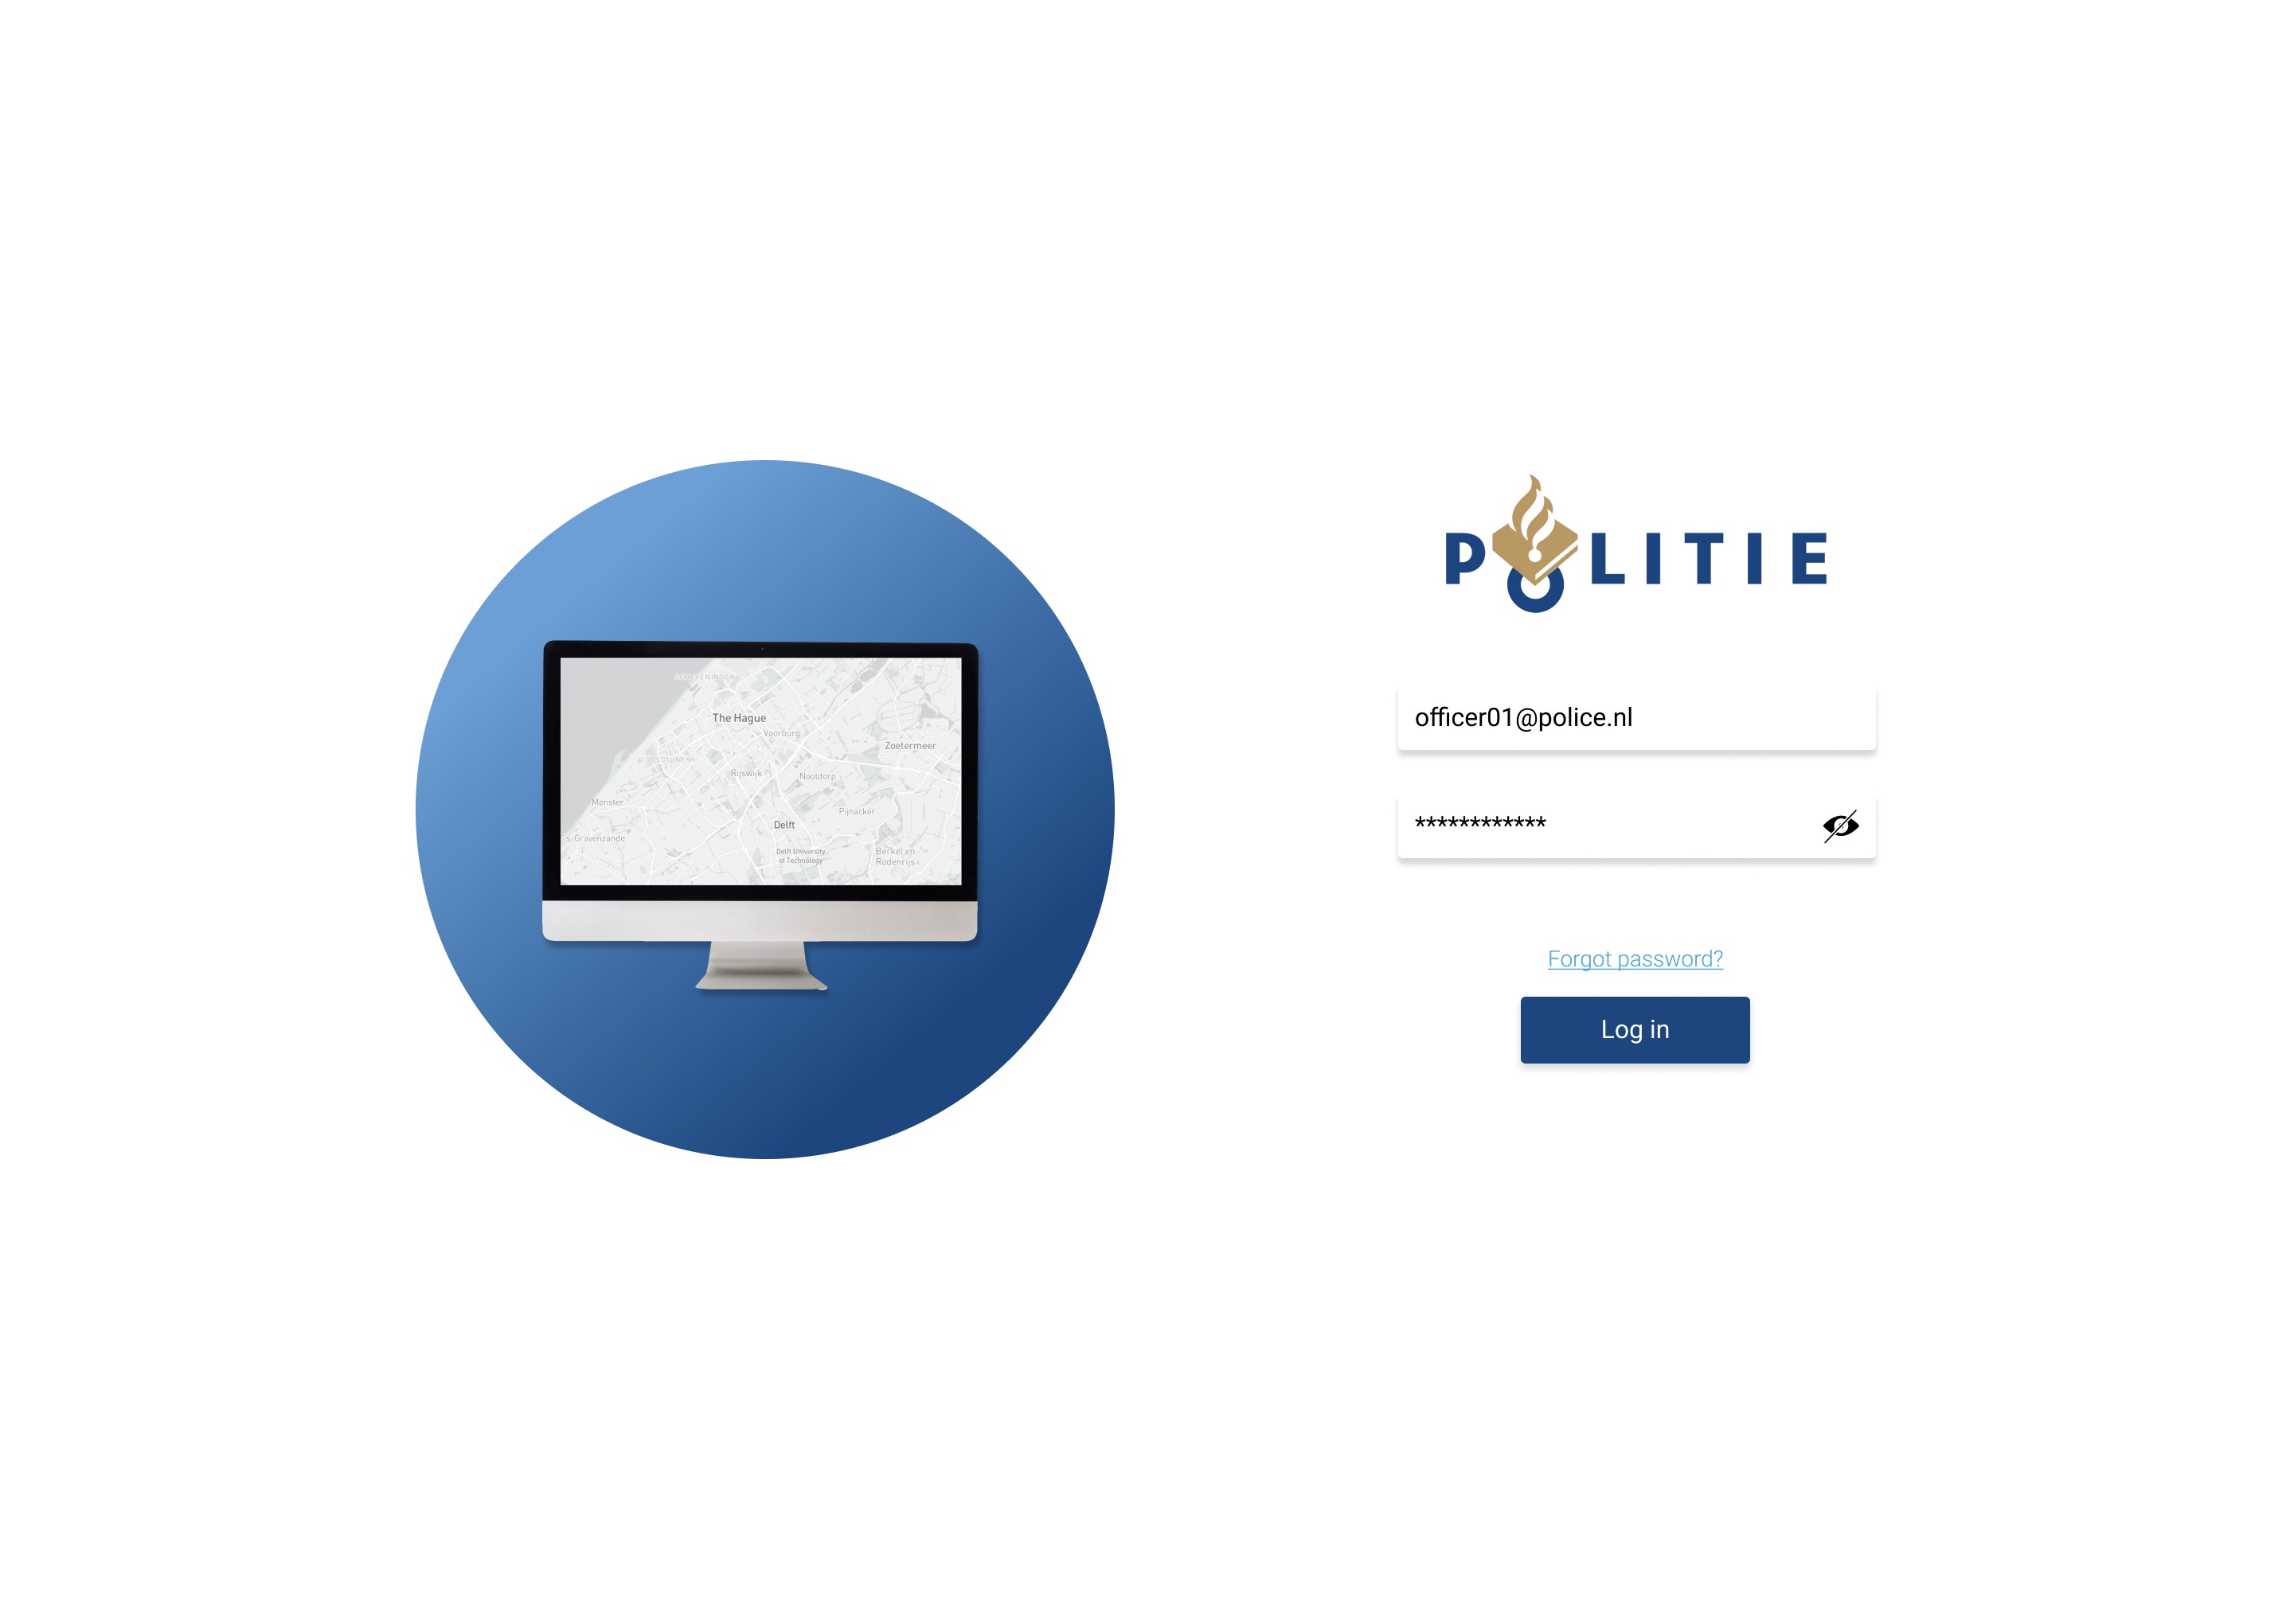
Our main focus was to promote the fact that each person works in his own way and that is why the interface should allow for customisability. By logging in to the map with credentials it is also easy for the Intelligence department to control the different levels of clearance officers have to the data stored on their servers.

The Dashboard

The dashboard allows officers to create and store their own customisable maps. This allows an officer to have separate maps for separate cases. For more advanced users the dashboard also allows an easy way to upload and activate and deactivate API:s that are relevant for the project. More data can also be requested from higher-ups incase something is missing from the project.

Customizable Presets

When creating a new map the user can customise the map to his liking by naming the map and typing in the specific case number. A theme can be selected that is suitable for said case. As the map is created using MapBox, advanced users can create their own maps and import them to style their work environment to their liking.

Filtering made easy

Hundreds of filters in the form of APIs and local data are stored in the police database. To make it easier for the police officers officers to choose relevant data, a way to categorise the filters needed to be implemented. A simple way to drag and drop filters from the category section to activate them was designed to make tackle this problem.

Data Clusters

As the map is zoomed out the data is shown as clusters as to not clutter the map and overwhelm the user with information.

High Criminality Addresses

When zoomed in, multiple Crimes at a single address are shown with a special icon, single crimes are showcased with corresponding custom icons. When the multiple crimes icon is clicked a panel opens from the left to showcase the different crimes at that address.

Panel interface

The right side panel of the interface appears when icons are clicked on the map. When an icon is clicked it showcases the report, date and time, connected reports, attached files and if scrolled down custom notes connected to the crime, and a street view picture of the crime spot.

Connect Clues

The user can press the icon with the two red dots located as a floating button in the upper right side of the screen to enter connect clues mode. In connect clues mode the user can connect data nodes with a red string. When reports are connected they will be shown as connected cases in the left pop out panel when any of the connected crime icons are clicked on the map.

Add Node

Located next to the connect clues button, is the add node button where the user can add his own custom icon to the map. This icon is customisable and only located on the users own case map.

Back to top
nordlinanton@gmail.comLinkedIn+358442855179